Evolution of water-in-oil emulsion controlled by droplet-bulk ion exchange.
Acoustic, electroacoustic, conductivity and image analysis.
A. Dukhin, and P. Goetz
Dispersion Technology Inc., 364 Adams Street, Bedford Hills, NY 10507, U.S.A.
ABSTRACT
Water-in-kerosene emulsion stabilized with SPAN surfactants exhibit a slow transition (on scale of hours) from an emulsion to a mini-emulsion state. We continuously monitor this transition in relatively concentrated samples (5% vl water), without dilution, using Acoustic, Electroacoustic and Conductivity measurements. Continuous stirring prevents sedimentation. We confirm our measurements with microscopic image analysis.
Acoustic measurements yield information about the droplet size evolution in time. The original droplets, having a size of about 0.4 micron, slowly coalesce into larger droplets. After 10 hours the droplet size has increased to about 5 microns. At this point a mini-emulsion fraction appears with a droplet size of only 25 nm and the droplet size distribution becomes bimodal. It takes another 24 hours for the emulsion droplets to completely transform into a mini-emulsion state.
The conductivity exhibits a rapid change during the first 10 hours of emulsion coalescence, but the rate becomes much slower as the mini-emulsion fraction begins to grow.
Electroacoustic measurements shows that the original emulsion droplets carry a substantial surface charge, which we are able to calculate using Shilov’s theory for overlapped DLs.
The measured electroacoustic signal gradually decays with time. In the final state the mini-emulsion droplets generate practically no electroacoustic signal and appear uncharged. This fact, combined with conductivity measurements, indicates a strong role for electrostatic factors in emulsion stability and its transition to mini-emulsion state. We suggest that ion exchange between the exterior and interior diffuse layers leads to a gradual collapse of the exterior DL and explains all the experimental observations.
Introduction
This paper might be of interest for people specializing in the following fields:
Properties of emulsions, mini- and micro-emulsions
Acoustic spectroscopy
Electrochemistry of non-polar liquids
Electrokinetics in non-polar liquids
Electroacoustics in low-conducting media
It is known that heterogeneous liquid-in-liquid system can exist in two general states:
thermodynamically unstable emulsion with a droplet size range on scale of microns;
thermodynamically stable microemulsion with a droplet size range on scale of nanometers.
Depending on the properties of the liquids, the surfactant content, the temperature, and mixing conditions, either of these states might initially emerge. For instance, according to the classic review by Davies and Rideal [1], there are at least three possible mechanisms for spontaneous emulsification that might occur when two immiscible liquids are placed in contact with each other, even without stirring. These mechanisms are: (1) interfacial turbulence; (2) negative interfacial tension; and (3) diffusion and stranding. Various authors have recently proposed additional mechanisms as described in the review [2]. All of these papers relate to emulsions, but it is also clear that if thermodynamic conditions allow, microemulsions might also form spontaneously right after mixing.
It is also known that under certain conditions emulsions can be converted into microemulsions, and vice versa. For instance, review [2] mentions several reports in which simply a quick shift in temperature induced a microemulsion-emulsion transition, paper [3] as an example. There is also an extensive theoretical review in [2] of various models describing spontaneous emulsification.
An emulsion-micro-emulsion transition is defined by a large change in droplet size. The size of emulsion droplets is normally measured on a micron scale, whereas the size of the micro-emulsion droplets is in the nanometer range. However, this difference in sizes is not an absolute rule. There are more and more instances reported in literature of emulsions with rather small droplet size. There is a special term introduced for these systems – mini-emulsions. They can be identical to micro-emulsions in droplet size, but still thermodynamically non-equilibrated as typical emulsions.
In this paper we describe our observations on how a water-in-oil emulsion evolves into a mini-emulsion. We are able to monitor this slow transformation thanks to new Acoustic and Electroacoustic characterization techniques based on ultrasound [4]. These methods eliminate the need for any sample preparation or dilution and allow us to continuously characterize the emulsion evolution in time.
Acoustic spectroscopy yields information about the particle size distribution. This method has several advantages over light scattering and other sizing techniques that turn out to be crucial for this work. For instance, this method is much more suitable for polydisperse systems than light scattering because weight basis is the innate basis of the measurement, as with sedimentation. This is the only way to monitor droplets with sizes on micron and nanometer scale simultaneously.
Acoustic measurements are particularly useful if they can provide data over a wide frequency range, for example 1 to 100 MHz. Emulsion droplets contribute to acoustic attenuation at low frequencies below 10 MHz, whereas microemulsion droplets affect primarily the high frequencies around 100 MHz. This investigation shows that only those ultrasound based instruments that are able to cover this wide frequency range are suitable for characterization of emulsions and mini/micro-emulsions.
The other ultrasound based technique, Electroacoustics, offers unique opportunities for characterizing electric surface properties of emulsions and mini- micro-emulsions. Although traditional microelectrophoretic experiments [5, 6] do reveal the importance of the electric surface charge on the water-oil interface, they are restricted to working with very dilute systems. There is always ambiguity left regarding the effect of the dilution on the emulsion.
Electroacoustics does not require dilution. This allows us to monitor the variation of electric surface properties continuously over many hours.
Electroacoustics offers one more advantage over more traditional methods. It is able to give information about the electric surface properties in non-polar liquids, whereas microelectrophoresis, with regard to emulsions, is restricted to aqueous systems. The most extensive evaluation of the water-oil interface charging has been made using oil-in-water emulsions [6]. The most recent review of the emulsion electrokinetics [5] mentions only aqueous emulsions.
Electroacoustics in non-polar liquids employs a new theory, recently created by Shilov and co-workers [7]. This electroacoustic theory takes into account overlap of DLs and other peculiar features of non-polar systems [8, 9, and 10]. We performed a special test that verifies some predictions of this new electroacoustic theory with regard to water-in-oil emulsions. Results of this test are in Appendix 1.
In this work we deal only with water-in-oil emulsions. Electroacoustics gives us the means to correlate the variation in the electric surface properties with variation of the droplet size. This is very important information for determining the role of electrostatic factors in emulsion stability.
Summarizing, we can formulate the following two goals of this paper:
Studying water-in-oil emulsions and mini- micro-emulsions;
Illustrating new methods for characterizing emulsions and mini- micro-emulsions
In order to achieve these goals we use our experience with the SPAN family of surfactants in kerosene. In our previous papers we showed that the conductivity linearly correlates with the concentration of SPAN [15]. This gives a simple way to control the ionic composition of a non-polar liquid. Water-in-kerosene emulsions with SPAN surfactants are very simple and reproducible in preparation. They exhibit very interesting evolution in time, starting with coalescence and then 10 hours later beginning a transformation into a mini-emulsion.
Materials and methods
We used the surfactant sorbitan mono-oleate, known also as SPAN 80, by Fluka. We used two different surfactant contents 1% and 5% by weight relative to kerosene.
We used kerosene from the hardware store. We tried several producers of kerosene and discovered practically no influence of the kerosene origin on the results of measurements. We used a value of 2 for the dielectric constant of kerosene because it is not clear how impurities would affect this number.
We used distilled water and water with 0.01 M KCl.
For emulsion preparation we add water to the kerosene solution with a certain concentration of the SPAN. Then we sonicate this solution for 2 minutes. The water content is 5%vl in all samples.
We measured the droplet size of water in the kerosene emulsions using the DT-1200 by Dispersion Technology. The acoustic sensor of this instrument allows us to characterize the particle size without dilution (for detail description see [4]). The average measurement time for these samples is about 6 minutes. These emulsions require continuous mixing to prevent settling, which is provided by the built-in magnetic stir bar in the DT-1200 sample chamber.
For conductivity measurements we used a Model 627 Conductivity Meter by Scientifica. It operates at 18 Hz with an applied voltage of about 5 V rms. The measurement range is from 20 to 20000 picosiemens/cm.
For electroacoustic measurement we use the Zeta Potential Probe DT-300 (for detailed description see [4]). This probe could be inserted directly into the sample vessel, as it is shown in Figure 1. An external magnetic mixer prevents settling of particles.
Droplet size evolution by Acoustic measurement
The attenuation frequency spectrum is the raw data for calculating the droplet size distribution. Figure 2 shows the attenuation curves as they evolved in time. Figure 3 illustrates just trends using simpler two-dimensional presentation. It indicates that low frequency attenuation begins to decay right after sonication stops. The high frequency attenuation begins to increase with a 10 hour delay.
This evolution of the attenuation spectra reflects the variation of the droplet size distribution. The procedure and theory for the calculation the droplet size distribution from these attenuation spectra is given in our book [4]. Figure 4 presents the droplet size distribution calculated at 5 hours intervals.
It is seen that during the first 10 hours the droplet size monotonically increases, corresponding to simple coalescence of the original emulsion droplets. During this initial period the median droplet size changes roughly from 0.4 to 2 microns.
Then, suddenly after 10 hours a fraction with an average size of 25 nanometers appears. The content of this fraction increases during the next 30 hours. The emulsion fraction continues to coalescence during this time, eventually reaching a size of about 7 microns.
The third period in the emulsion evolution begins roughly after 40 hours. At this point the emulsion converts completely to the small size state. After this the attenuation spectra becomes stable and evolution of the droplet size stops.
Comparison of these droplet size distributions with attenuation spectra reveals a very simple correlation. The attenuation at low frequencies below 10 MHz corresponds to the emulsion droplets, whereas the high frequency attenuation is induced by the small size droplets. Figure 5 illustrates this correlation.
We would like to stress the importance of being able to collect attenuation data over a wide frequency range. The absence of frequency data below 20 MHz would simply miss the variation of the emulsion fraction. Similarly, the absence of high frequency data would miss the variation due to the small size fraction.
At this point in the discussion we do not know the nature of the small droplets. They might be either micro-emulsion or mini-emulsion droplets. We use sedimentation analysis and image analysis to answer this question. We also do not know at this point the reason for the strange kinetic behavior. Next we will consider Electroacoustic measurements to help get these answers, because it yields information about the surface properties of the water droplets.
Mini-emulsion or micro-emulsion?
The evolution of the emulsion described in the previous section occurs under conditions of continuous stirring. We use a magnetic stirrer to prevent sedimentation of the original emulsion.
If we turn the stirrer off after the system reaches a steady state, the water droplets sediment. If system was a thermodynamically micro-emulsion, we would observe no sedimentation effect. Hence sedimentation points toward a thermodynamically unstable mini-emulsion. This mini-emulsion turns into sedimenting emulsion when stirrer is turned off.
At the same time there is no phase separation. If we turn the stirrer on again, the system exhibits the same acoustic properties as before sedimentation occurred with the same small droplet size.
These observations indicate that we are dealing with an unstable mini-emulsion, which undergoes coalescence after stirring is turned off.
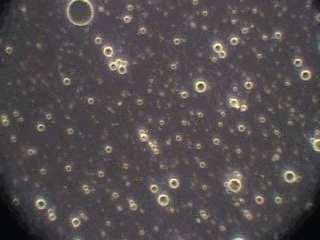
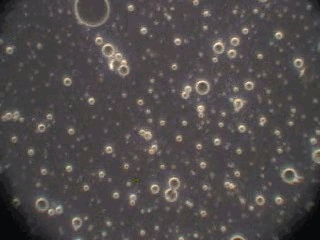
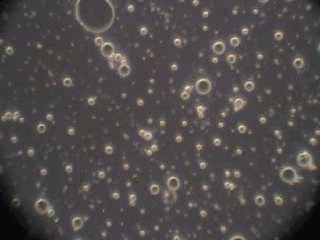
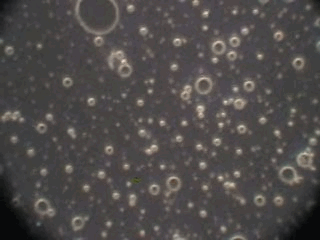
In order to verify this hypothesis we performed a microscopic analysis of the system after stirring is turned off. We used a dark field microscope with a digital camera to capture images continuously for an hour.
Figure 5 shows five snapshots of the emulsion image at intervals of 10 minutes. It is clearly seen that the size of the emulsion droplets grows with time. However, the large droplets of micron size do not coalescence. The growth that we observe is apparently related to the capturing of the very small droplets by the larger ones. These small droplets look like bright dots in the dark field. Microscopy does not allow estimate of their sizes, which are clearly less than a micron.
This microscopic test confirmed that the system contains a number of very small droplets, which slowly coalescence in larger droplets with higher degree of aggregative stability. Stirring breaks quickly these large droplets into the smaller ones. These small mini-emulsion droplets dominate the acoustic attenuation, which is measured under stirring conditions.
Role of the Surfactant content and Ionic strength of water.
An increase in the surfactant content in oil and the ionic strength of the water leads to the same result, it inhibits observed evolution. The attenuation spectra remain practically unchanged in time at 5% surfactant content. It also does not change if water contains 0.01 M KCl.
These two factors produce different effects on the initial droplet size, right after sonication.
Increasing the ionic strength of the water causes practically no change in the initial droplet size.
Increasing the surfactant content from 1% to 5% causes a reduction in the droplet size by more than 2 times. This indicates that the emulsion with only a 1% surfactant content experiences a deficit of surfactant for complete development of the water-oil interface.
These are just preliminary observations. They prove that surfactant content and ionic strength of water are important factors of the observed phenomena. It would take more experiments for detail understanding their role.
Surface charge evolution by Electroacoustic and Conductivity measurements
Electroacoustic measurement in non-aqueous systems involves three steps.
The first step is calibration with 10% silica Ludox in 0.01 M KCl aqueous solution. The z -potential of this dispersion is –38mV, which is the basis for calibration.
The second step is the measurement of the electroacoustic signal of pure kerosene. This gives us the value of the background or ion vibration signal. The DT-300 software allows us to save this value and to subsequently subtract this background signal from further measurements. It is vector subtraction because electroacoustic signal is a vector with a certain magnitude and phase.
As a simple test that this subtraction works, we measured kerosene again, this time making the background subtraction. This test gives us the value of the noise level of the electroacoustic measurement.
The third step is the actual measurement of the electroacoustic signal generated by the water-in-kerosene emulsion. This signal substantially exceeded the noise level, as shown on the bottom plot of Figure 7. With time, the CVI magnitude gradually decreases, and reaches the noise level at the end of the experiment. From this CVI behavior with time we can conclude that:
the microemulsion droplets do not contribute to the CVI signal
the emulsion droplets do contribute to the CVI signal.
There are several ways to explain the peculiarities of this system, which will be discussed below.
We can use the CVI values at the initial stage of coalescence for calculating the surface charge s of the water droplets. According to Shilov’s theory (Appendix 1, Eq.1.8), this calculation requires certain input parameters, such as the properties of liquids and the size of the water droplets. Acoustic attenuation measurements yield information about the droplet size. As for the liquids properties, we use the following values: r m =0.8 g/cm3; r p =1 g/cm3; h =1.5 cp; e m =2; e p =80. All these parameters are corrected for temperature.
Figure 8 shows the resulting values for the surface charge evolution during the stage of emulsion coalescence. It is seen that it decays quickly with time, decreasing by almost 10 times during first 10 hours.
The question arises about the mechanism for this effect. Does this mean that the adsorbed SPAN molecules are losing charges they carry to the surface? Is there any other explanation that would not involve restructuring of the SPAN molecules?
In answering these questions we should keep in mind a clear correlation between the apparent surface charge decay and the conductivity increase, as shown in Figure 8. It appears that the droplets release ions into the kerosene while coalescing. We suggest a model that explains this feature in the next section.
It is important to mention that the conductivity of the initial kerosene-SPAN 80 solution is about 310 10-10 S/m. The conductivity of the initial emulsion is less than this value. It appears that the water droplets adsorb SPAN and reduce the conductivity. However, with time the conductivity increases, eventually exceeding the initial value in the kerosene-SPAN solution (see Fig.8).
Conductivity measurements allow us to estimate the ka value and determine the validity of Shilov’s theory in regard to this system. It is known that Shilov’s theory is valid only for overlapped DLs. Figure 10 shows the relationship between the volume fraction and ka for overlapped DLs. A more detailed description is given in our book [4]. It is seen that at a volume fraction of 5% the DLs do overlap if ka <1. This is the range of ka values when Shilov’s theory can be applied.
Figure 8 presents ka values calculated using the measured conductivity and the particle size computed using Attenuation Spectroscopy. We also assumed that there are simple small ions in the kerosene phase with an approximate diffusion coefficient of 10-5 cm2 /sec. If this assumption is valid, ka satisfies the condition of overlapped DLs during the complete initial period of emulsion coalescence. This is a justification for using Shilov’s theory for calculating the surface charge.
In the next section we suggest a model that links together these experimental data.
Discussion
We have established that the evolution of the water-in-kerosene emulsion with SPAN 80 as emulsifier proceeds in three distinct periods.
Period 1: first 10 hours
.The water droplets are coalescing. The apparent surface charge of the droplets decays. The conductivity increases, eventually exceeding the initial value in the kerosene-SPAN solution.
Period 2: between 10and 40 hours
The mini-emulsion fraction appears and grows. The emulsion droplets continue to coalescence. The CVI continues to decay at the same rate. The rate of conductivity increase is much smaller.
Period 3: after 40 hours
All parameters are stable. There are no emulsion droplets. The water is in mini- and possibly micro-emulsion droplets. These droplets do not generate any CVI signal.
It is quite possible that there are multiple explanations of this set of facts. Here we just suggest one of them. We do not claim that it is the only one. We want to be absolutely clear that it is just one of, perhaps, several possible models.
Our model is based on the assumption that the water-kerosene interface with adsorbed SPAN remains unchanged. We assume that the SPAN molecules stabilized this interface almost instantly during initial sonication and brought it to thermodynamic equilibrium. However, it is only a local equilibrium for each small element of the interface.
The part of the SPAN molecules in the bulk of the solution is responsible for the conductivity of the original kerosene-SPAN solution. It means that they carry charge, either as individual molecules, or as micelles (see our previous paper [15]).
It is also possible that at least a fraction of the adsorbed SPAN molecules is charged and brings this charge to the surface.
We assume that the electric charge of the water-kerosene interface that is associated with adsorbed SPAN molecules remains constant, time independent. Local thermodynamic equilibrium is the justification for this assumption.
We attribute the observed evolution of the parameters to ion exchange between the interior of the water droplets and the bulk of the kerosene solution
Initially the water droplets have an electro-neutral interior. Ions are trapped inside of the large water droplet at about equal amounts. The surface charge induced by adsorbed SPAN molecules is screened with an external diffuse layer in the kerosene solution. Figure 9 illustrates this structure.
The external diffuse layers are very thick due to the low ionic strength. They are overlapped. This gives rise to the CVI signal. We could estimate the amount of energy Wext required to charge this external DL to a certain level of surface charge Q as:
![]() (1)
(1)
where S is the surface area, k ext is Debye parameter for external DLs.
Obviously, there is another possibility to screen the surface charge induced by SPAN adsorption. It could be done with screening diffuse layer inside of the particle. This second opportunity would also take a certain amount of energy, which we could estimate with following equation:
![]() (2)
(2)
Comparison of these two charging energies yields the following approximate result:
 (3)
(3)
where we have assumed that the conductivity of water is about 106/40 times larger then conductivity of kerosene, the effective diffusion coefficients Deff being the same, and that the Debye parameter can be given with the following equation:
![]() (4)
(4)
This is certainly a very approximate estimate. However, it clearly indicates that charging of the interior DL to a certain charge is orders of magnitude more energy efficient than exterior one.
It is important to mention that charging up to certain electric potential level would lead to opposite conclusion. We believe that in this case we are dealing with the constant surface charge case because it is related to the adsorption of thermodynamically determined amount of surfactant.
The above mentioned difference in energy for charging the DLs creates a driving force for co-ions to leave the interior of the droplet thus generating an internal electric charge that would screen the adsorbed surface charge. Eventually this would lead to the complete collapsing of the external DL. The surface charge of the adsorbed SPAN would be completely compensated by the interior charge of the water droplet. Figure 9 illustrates this final stage of the transition.
This model could explain all observed features of the emulsion-microemulsion transition.
First of all, it explains why the conductivity increases during the coalescence period and eventually significantly exceeds the conductivity level of the original kerosene-SPAN solution (see Fig.8). This excess conductivity comes from the counter-ions released from the water droplets into the kerosene.
There is another model that could potentially explain some of the observed facts. It would imply restructuring of the adsorbed SPAN molecules, would not explain the excess conductivity. This is a serious argument supporting the “ion exchange model”
The “ion exchange model” also explains the lack of the CVI signal for the microemulsion. It happens because the surface charge of the adsorbed SPAN molecules is completely screened with internal charge of the microemulsion droplet. Consequently it looks from the outside as being electro-neutral.
In this model redistributing screening electric charge from the outside diffuse layer to the inside one is a limiting factor of the emulsion droplet break up into much smaller mini- and possibly micro-emulsion droplets. Apparently this break up occurs when a sufficient critical amount of energy is released due to the collapsing external DL.
Another potential factor controlling this break up, particle size, seems not important at all. We could conclude this based on the observation that the size of the emulsion droplets continues to grow during Period 2. If break up would relate to the droplet size, we would observe growth only up to certain maximum value of the size. It is obviously not the case.
This break up is not exactly a spontaneous one because it strongly dependent on the presence of stirring. However, stirring with magnetic stir bar in the DT-1200 chamber is not vigorous a vigorous one. It is clear that reduction of the surface tension is a most important factor. In this sense the observed phenomena is similar to the “negative interfacial tension” mechanism of spontaneous emulsification [2].
It is also possible that combination of stirring and reduction of the surface tension intensifies “interfacial turbulence” described in the paper [16]
At the end, we would like to repeat that the suggested mechanism explains all the experimental facts, but we could not claim that it is the only one to do so. There might be some other explanations of the phenomena presented in this paper.
Conclusions
We have established that water-in-kerosene emulsion with SPAN 80 as emulsifier undergoes transition from emulsion to mini-emulsion when being slowly stirred. This transition takes approximately 40 hours and proceeds in three distinct periods.
Period 1: first10 hours
.Water droplets are coalescing. The apparent surface charge of the droplets decays. The conductivity increases, eventually exceeding the initial value in the kerosene-SPAN solution.
Period 2: between 10 and 40 hours
. A mini-emulsion fraction appears and grows in size. The emulsion droplets continue to coalesce. The CVI continues to decay at the same rate. The rate of conductivity increase is much smaller.
Period 3: after 40 hours
. All parameters are stable. There are no emulsion droplets. Water is in mini-emulsion and possible micro-emulsion droplets. These small droplets do not generate CVI signal.
We concluded that ion exchange between the interior of the water droplets and the bulk of kerosene solution could explain these experimental observations making no assumption about restructuring of the adsorbed SPAN molecules with time. This ion exchange leads to a gradual collapse of the exterior diffuse layer. The surface charge associated with the adsorbed SPAN molecules becomes screened with an interior diffuse layer. This process leads to the reduction of the surface tension and eventual break up of the emulsion droplet into much smaller mini- and possibly micro-emulsion droplets. The decay of the CVI signal and increasing conductivity are results of this ion exchange.
Appendix 1. Electroacoustic theory for water-in-oil emulsions and its verification.
It is known that existing electroacoustic theories [4, 11, 12, 13, and 14] for both ESA and CVI effects do not take into account overlapping of the double layers (DL). There is only one exception, the recently created Shilov’s theory [7].
Assumption of isolated, not-overlapped, double layers requires either a large droplet radius a or a sufficiently high ionic strength leading to a shorter Debye length k -1. Figure 10 illustrates approximately the range of volume fractions j where assumption of isolated DLs is valid for given ka, following our book [4].
If we assume that thin DLs do not overlap, we can use a widely accepted expression for the dynamic electrophoretic mobility m d (Eq.5.28 in [4]), that is:
![]() (1.1)
(1.1)
where e 0 and e m are dielectric permittivities of the vacuum and liquid, z is the electrokinetic potential, h is dynamic viscosity, r m ,r p and r s are the densities of liquid, particle and dispersion, ![]() ,
, ![]() , Km is conductivity of the media, w is frequency of ultrasound and Du = κσ /Km a is the Dukhin number that reflects the contribution of the surface conductivity k s .
, Km is conductivity of the media, w is frequency of ultrasound and Du = κσ /Km a is the Dukhin number that reflects the contribution of the surface conductivity k s .
Function G presents the contribution of hydrodynamic effects, whereas function F reflects electrodynamic aspects of the electroacoustic phenomena.
In order to apply this theory to water-in-oil emulsions we should simply introduce the conductivity of the particles in the expression for function F. A water-in-oil emulsion can be considered as conducting particles in a non-conducting media. In order to achieve this we should simply use more general expression for the Dukhin number:
![]() (1.2)
(1.2)
where Kp is conductivity of water droplets.
This modified Dukhin number can be used in the general expression for the F function:
 (1.3)
(1.3)
The properties of the water-in-oil emulsion allow us to approximate the value of this function. It is known that the conductivity of water is much higher than the conductivity of non-polar liquids. This means that
![]() (1.4)
(1.4)
In addition, the dielectric permittivity of water is about 40 times higher than the permittivity of non-polar liquids:
![]() (1.5)
(1.5)
Using these two strong inequalities we can neglect 1 in comparison to the relevant parameters in Eq 1.3. As a result we get the following approximate value for the function F in water-in-oil emulsions:
 (1.6)
(1.6)
This approximate value is actually quite accurate due to the large conductivity and permittivity of water.
If we use this value for function F in Eq.1.1 for the dynamic mobility, we would come to the interesting result:
![]() for thin isolated DLs only (1.7)
for thin isolated DLs only (1.7)
This means simply that:
water-in-oil emulsions with isolated and thin DLs should not exhibit any electroacoustic effect.
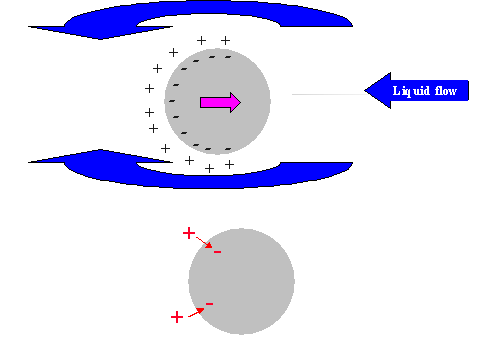
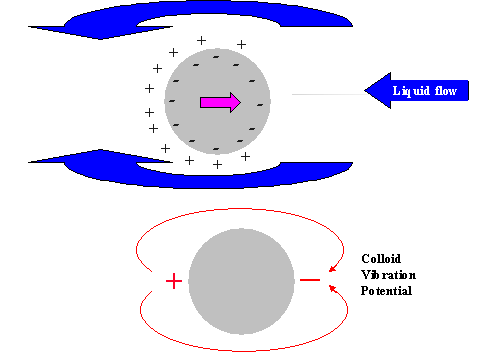
It is possible to give a simple explanation to this unexpected conclusion. In order to do this we compare the electric field structure induced by the relative particle-liquid motion for non-conducting and conducting particles, as illustrated in Figure 11.
It is known that ultrasound generates particle motion relative to the liquid due to the density contrast. In drawing Figure 11 we assume that the particles move from left to right. This causes a liquid motion, relative to the particle surface, which is illustrated with arrows above and below the particle.
This motion of this liquid drags ions within the diffuse layer towards the left pole of the particle. This redistribution of the diffuse layer leads to the different results for conducting and non-conducting particle.
In the case of non-conducting particle, the surface charge can not move. It retains its spherical symmetry. As a result the particle gains an excess negative charge at the right hand side pole and excessive positive charge at the left hand side pole. It gains a dipole moment. This dipole moment generates an external electric field, which gives rise to the Colloid Vibration Current.
In the case of a conducting particle, the charge carriers inside the particle can follow the counter-ions of the DL that are being dragged to the left hand side pole. This means that the surface charge, or charge associated with the particle, loses its internal spherical symmetry as well as the charge of the diffuse layer. Most importantly, each element of the surface, as well as the adjacent diffuse layer, remains electro-neutral. No external electric field appears and Electroacoustic effect is practically zero.
Does this mean that electroacoustics is useless for water-in-oil emulsions?
The answer is No.
So far we have considered a water-in-oil emulsion with thin isolated DLs. In the water-in-oil emulsions with overlapped DLs the nature of electroacoustic effect is quite different.
Homogeneous distribution of the counter-ions eliminates polarization charges induced on the left hand side pole of the particles by the liquid motion. The electroacoustic effect is related simply to the displacement current of the oscillating motion of the particle surface charges.
There is only one electroacoustic theory that takes into account DLs overlap. It was created in the year 2002 by Shilov and colleagues [7]. It yields the following expression for the dynamic mobility:
 (1.8)
(1.8)
where s is surface charge density, W is a hydrodynamic drag coefficient, and w is the ultrasound frequency.
It is seen that there are no electrodynamic parameters for either the particles or the media are involved in this expression. This leads us to the conclusion that, in the case of overlapped DLs, water-in-oil emulsions generate an electroacoustic signal in a similar manner as non-conducting particles.
According to Shilov’s theory, in the case of overlapped DLs, we can calculate the surface charge of the particles from the dynamic mobility knowing nothing about the relevant ions or even the ionic strength. We know of only one other electrokinetic theory with a similar level of simplicity – Smoluchowski theory.
This general nature of Shilov’s theory is especially important for non-polar liquids. We have currently very little knowledge and few means to collect information about ions in these liquids. We have published recently a paper that addresses this issue in more detail [15].
The calculation of z -potential does require information of the ions, because it includes Debye length ![]() (1.9)
(1.9)
where T is absolute temperature, F is Faraday constant, R is a gas constant,
This simple analysis leads us to the following conclusions:
water-in-oil emulsion with isolated DLs should not generate any electroacoustic signal;
measurable electroacoustic signal generated by water-in-oil emulsion indicates that DLs are overlapped;
References.
Davies, J.T. and Rideal E.K. “Disperse systems and adhesion”, In Interfacial Phenomena, 1st Ed., Ed. Willmer, H., pp. 343-450, Academic Press, NY, 1961.
Lopez-Montilla, J.C., Herrera-Morales, P.E., Pandey, S. and Shah, D.O. “Spontaneous Emulsification: Mechanisms, Physicochemical Aspects, Modeling and Applications”, J. Dispersion Science and Technology”, 23 (1-3), 219-268 (2002)
Kunieda, H., Fukui, Y., Uchiyama, H., Solans, C. “Spontaneous formation of Highly Concentrated Water-in-Oil Emulsions”, Langmuir, 12, 9, pp. 2136-2140 (1996)
Dukhin A.S. and Goetz. P.J. “Ultrasound for characterizing colloids”, Elsevier, 2002
O.Boen, Ho. “Surfactant stabilized emulsions from an Electrokinetic perspective”, in Interfacial Electrokinetics and Electrophoresis, ed. A.V.Delgado, Marcel Dekker, p.869-892, 2002.
Marinova, K.G., Alargova, R.G., Denkov, N.D., Velev, O.D., Petsev, D.N. Ivanov, I.B., Borwankar, R.P. “Charging of oil-water interfaces due to spontaneous adsorption of hydroxyl ions”, Langmuir, 12, pp.2045-2051 1996.
Shilov, V.N., Borkovskaja, Yu.B., and Dukhin A.S. “Electroacoustic theory for concentrated colloids with arbitrary k a. Nano-colloids. Non-aqueous colloids.”, JCIS, submitted
Kitahara, A. “Nonaqueous systems”, in Electrical Phenomena at Interfaces, ed. By Kitahara. A. and Watanabe, A., Marcel Decker, 1984
Hoeven, van der Ph.C. and Lyklema, J. “Electrostatic stabilization of suspensions in non-aqueous media”, Adv. In Colloid and Interface Sci., 42, pp. 205-277 (1992)
Morrison, I.D. “Electrical charges in non-aqueous media”, Colloids and Surfaces, A., 71, p.1-37, 1993
O’Brien, R.W., Wade, T.A., Carasso, M.L., Hunter, R.J., Rowlands, W.N. and Beattie, J.K. “Electroacoustic determination of droplet size and zeta potential in concentrated emulsions”, JCIS, (1996)
Babchin, A.J., Chow, R.S. and Sawatzky, R.P. “Electrokinetic measurements by electroacoustic methods”, Adv. Colloid Interface Sci., 30, 111 (1989)
Dukhin, A.S., Shilov, V.N, Ohshima, H., Goetz, P.J “Electroacoustics Phenomena in Concentrated Dispersions. New Theory and CVI Experiment”, Langmuir, 15, 20, 6692-6706, (1999)
Dukhin, A.S., Shilov, V.N, Ohshima, H., Goetz, P.J “Electroacoustics Phenomena in Concentrated Dispersions. Effect of the Surface Conductivity”, Langmuir, 16, 2615-2620 (2000)
Dukhin, A.S. and Goetz, P.J. Colloids and Surfaces. Submitted
Rudin, J., Wasan, D.T. “Interfacial turbulence and spontaneous emulsification in alkali-acidic oil systems”, Chemical Engineering Science, 48, 12, 2225-2238 (1993)
Figures Tittles
Figure 1. Photograph of DT-300 Zeta Potential Probe inserted into the alumina-kerosene-SPAN 80 dispersion.
Figure 2. Attenuation frequency spectra evolution in time.
Figure 3. Attenuation frequency spectra at the beginning and at the end of experiment. Arrows show trends in attenuation evolution
Figure 4. Evolution of the droplet size distribution in time.
Figure 5. Emulsion evolution after stirrer is turned off. The width of each picture is approximately 100 microns.
Figure 6. Correlation between parameters of the droplets size distribution and attenuations.
Figure 7. Correlation between emulsion droplets content and measured conductivity and electroacoustic signal.
Figure 8. Correlation between measured conductivity and calculated apparent surface charge density.
Figure 9. Illustration of the double layer restructuring due to the ion exchange between interior and exterior of the water droplet
Figure 10. Estimate of the volume fraction of the overlap of the electric double layer
Figure 11. Illustration of the exterior DL polarization by the liquid flow relative to the particle surface induced with ultrasound
Figure 1. Photograph of DT-300 Zeta Potential Probe inserted into the alumina-kerosene-SPAN 80 dispersion.
Figure 2. Attenuation frequency spectra evolution in time.
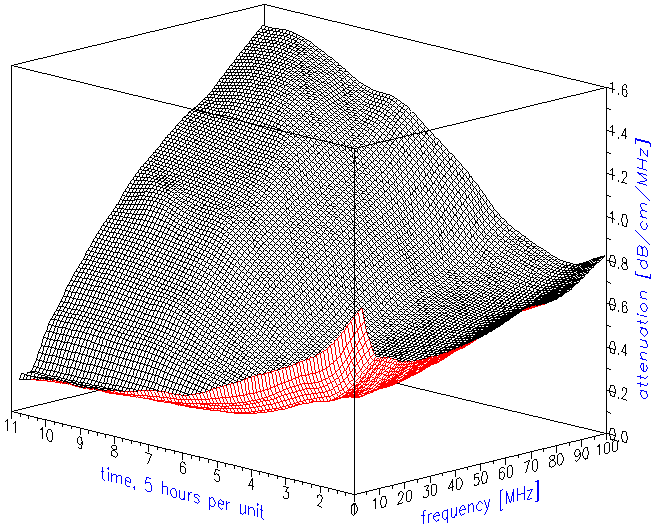
Figure 3. Attenuation frequency spectra at the beginning and at the end of experiment. Arrows show trends in attenuation evolution.
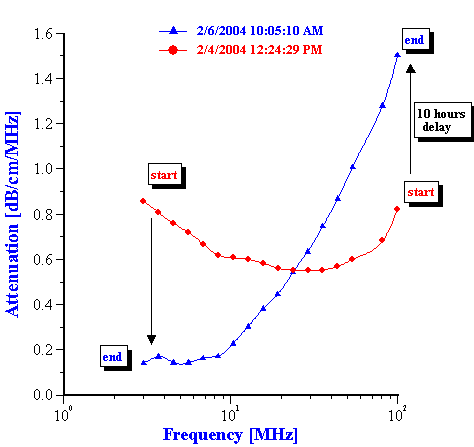
Figure 4. Evolution of the droplet size distribution in time.
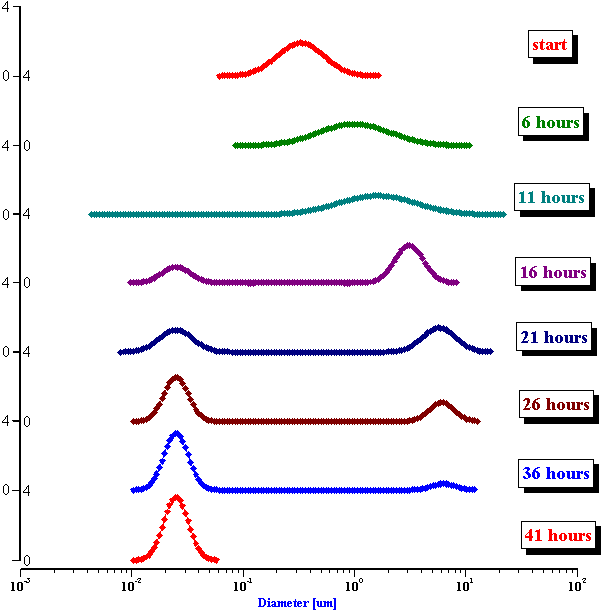
Figure 5. Emulsion evolution after stirrer is turned off. The each picture width is about 100 microns.
Start
10 minutes
20 minutes
30 minutes
40minutes
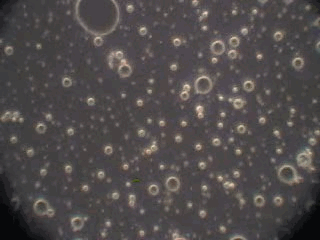
Figure 6. Correlation between parameters of the droplets size distribution and attenuations.
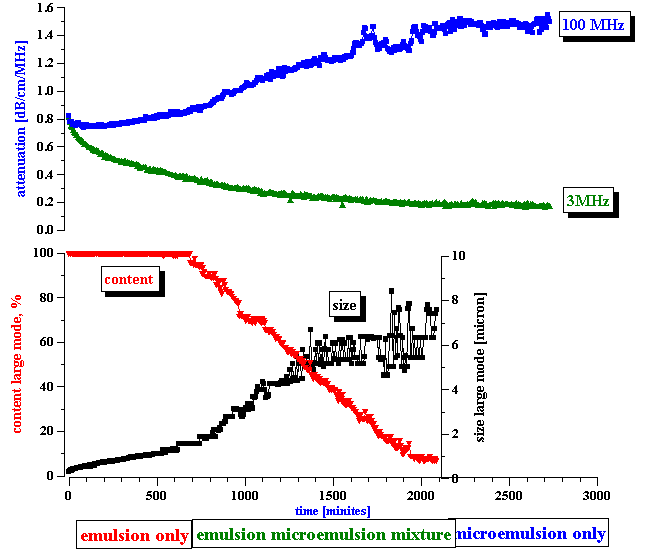
Figure 7. Correlation between emulsion droplets content and measured conductivity and electroacoustic signal.
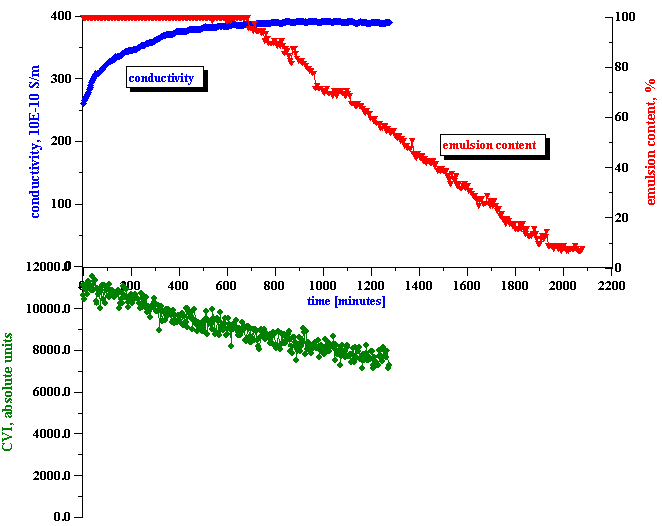
Figure 8. Correlation between measured conductivity and calculated apparent surface charge density.
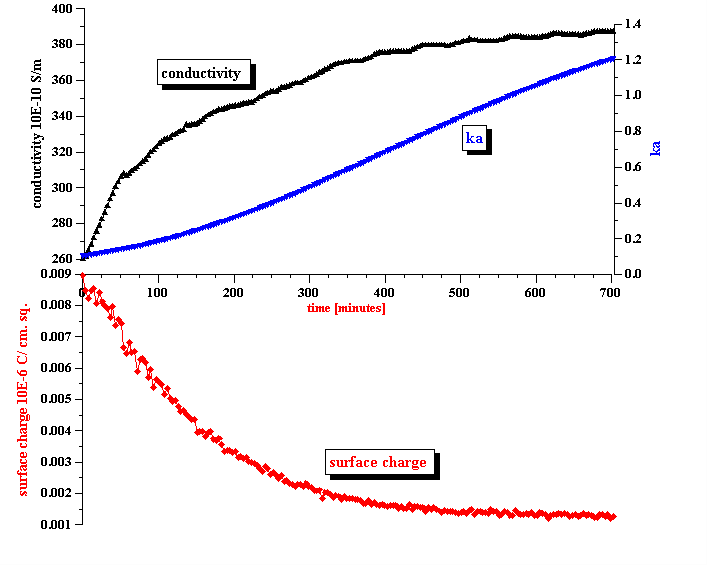
Figure 9. Illustration of the double layer restructuring due to the ion exchange between interior and exterior of the water droplet.
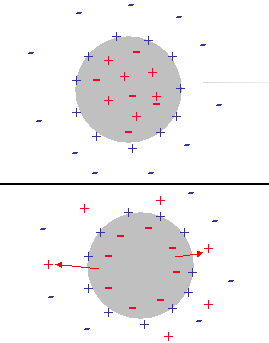
Figure 10. Estimate of the volume fraction of the overlap of the electric double layer
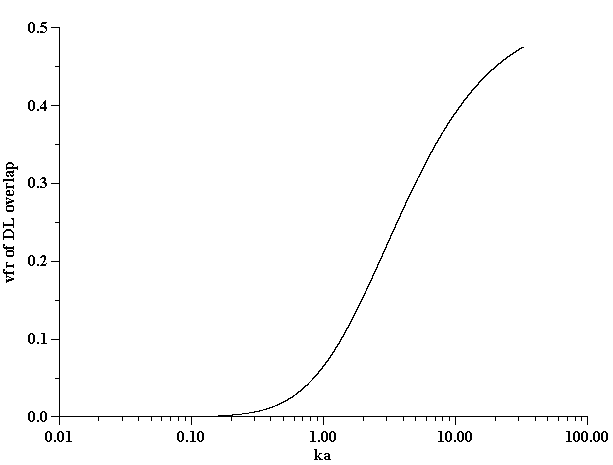
Figure 11. Illustration of the exterior DL polarization by the liquid flow relative to the particle surface induced with ultrasound.
Non-conducting partricle.
Conducting partricle.
