Surfactant Titration of Kaolin Slurries
using Zeta Potential Probe
A.S.Dukhin1*,P.J.Goetz1, S.Truesdail2
1Dispersion Technology Inc., 3 Hillside Avenue, Mount Kisco, NY 10549, USA
2Engelhard Corp., Highway 18 Spur, P.O. Box 37, Gordon, GA31031
CVI measurement.
Electroacoustic spectrometer DT-300 consists of two parts: an electronic part and a sensor.
Allelectronics are placed on two special purpose boards (Signal Processor and Interface). The device also requires a conventional Data Acquisition Card (DAC). The Signal Processor board and DAC thereby allowing instrumentation control via a personal computer and Windows based software.
The electroacoustic sensor probe contains a piezoelectric transducer with a critical frequency of 3-MHz and a sensing electrode which is placed on the surface of the transducer. This electrode is separated from the external reference electrode with a non-conducting rigid ceramic insert. Internal electric impedance between these electrodes can be selected depending on the conductivity range of the samples by means of an internal transformer. The transformer is selected such that the input impedance is significantly less than the external impedance of the sample such that the resultant signal is proportional to the short circuit current. This transformer is located just behind the central electrode in order to minimize the stray capacitance.
There is a special low acoustic impedance plastic rod between the transmitting transducer and the sensing electrode. This rod adjust acoustic impedance of the probe and dispersion eliminating a high reflection on this surface. This additional rod opens a way to calibrate an absolute power using reflection on the transducer-rod surface.
he Signal Processor generates the transmit gate which defines the 1 Watt pulse generated in the Interface module as well as the necessary signals to set the frequency. Electroacoustic measurements can be performed either for one frequency or for the chosen set of frequencies from 1 to 100 MHz. A transducer converts these pulses into sound pulses with some certain efficiency. This sound pulse propagates through the quartz delay rod, acoustic impedance rod and eventually through the sample. The acoustic pulse propagates through the sample exciting particles through disturbances to their double layers. Particles gain dipole moments because of this excitation. These dipole moments generate an electric field. This electric field changes the electric potential of the central sensing electrode. The resulting difference in the electric potentials between central electrode and external reference electrode causes an electric current. This current is registered as Colloid Vibration Current. The value of this current is very low. It takes an average of at least 800 pulses in order to achieve the high signal to noise ratio. The number of pulses depends on the properties of colloid. Measurement of CVI in low conducting oil based systems requires averaging of millions pulses. In principle, this method makes it possible to measure any low energy signals.
The general expression for the local CVI for concentrated (up to 40%vl) and polydisperse system has been derived in the paper [ 6 ]:
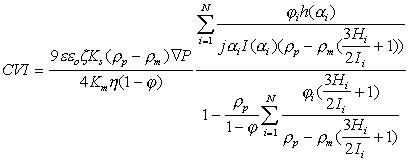 (1)
(1)
where e and e0 are dielectric permittivities of the media and vacuum, Ks and Km are conductivities of the dispersion and media, j is volume fraction of solid, r p and r m are densities of the particles and of the media, j is an imaginary unit, special functions h, H and I are defined in the paper [ 6 ].
This expression contains one unknown parameter: P pressure. A pieso crystal converts initial 1W electric signal to sound with low efficiency, about 40dB loss. The efficiency of this conversion is frequency dependent which results in an additional problem for frequency CVI spectra measurements. Sound intensity from a pieso crystal is rather low and not very well defined. Each pieso crystal has a unique efficiency. The pulse propagates through the delay rod, acoustic impedance rod and partially reflects from the sensor-liquid surface. This changes amplitude of pressure again. As a result we do not know exact pressure at the point of the measurement.
In addition, the geometry calibration constant C characterizes the complex distribution of the electric and sound fields near the electrode’s surfaces.Neither of these parameters (C and P) are known. Both of these unknowns can be excluded through a calibration procedure.Colloid Vibration Current can be presented in the following simplified form:
CVI=C * z * ÑP * G( j ,a) * Zdis / (Zdis + Zrod )(2)
where multiplier with acoustic impedances of the dispersion Z and impedance rod Z characterizes reflection on the probe surface, function G is defined with Eq.1.
In order to eliminate the unknown constants C and P, the authors used a suspension of Ludox diluted to 10% wt with 10-2 mol/l KCl. These silica particles have a zeta potential of -38 mV at pH 9.3. CVI value for this colloidal silica can be expressed as follows:
CVIsil = C * zsil *ÑP *G(jsil, asil) * Zdis.sil / (Zdis.sil + Zrod )(3)
From this equation we can calculate the unknown C and P variables and use them for calculating CVI for other samples:
CVI=CVIsil * z /zsil* G(j,a)/G(jsil , asil) * Zdis (Zdis.sil + Zrod )/ (Zdis + Zrod ) Zdis.sil(4)
Expression (4) can be used for calculatingzeta potential from the magnitude of the CVI.
In addition, the DT-300 measures a phase of the CVI signal. This phase yields particle size information.In the case of a single frequency, this measurement provides only a mean particle size. In the case of the multiple frequencies, more detail information about particle size distribution is available. However, according to our experience, acoustic spectroscopy is much more suitable for characterizing the particle size distribution [ 3 ].
Titration protocol
The DT-300 software has several optional titration protocols for running two burettes. These burettes are able to inject chemicals with increments as low as 0.2 micro liter.The most common titration being for pH. The user should specify maximum and minimum pH, number of pH intervals, number of sweeps and direction. The software package assumes 1N acid and base. In addition, the user can change equilibration time, tolerance, sample volume, etc.
Equilibration time is very important parameter. Titration makes sense only if it follows the equilibrium root. Some systems exhibit a very long equilibration time. A good example is observed in the case of a concentrated zirconia dispersion. Figure 1 shows the evolution of the zeta potential and pH of the 3%vl zirconia dispersion as a function of time. The equilibration time is about 30 minutes. In comparison, silica Ludox reaches equilibrium in a fraction of a minute. A typical equilibrium titration of the silica Ludox at 10%wt is shown in Figure 2. The observed differences in equilibration time serve to highlight the importance of allowing each sample to reach a steady state before analysis.
For the purpose of this paper another important protocol needs mentioned. It is called “ml protocol” in the DT software. The user specifies a total amount of the injected substance and number of titration points. The burette automatically injects this substance, waits the specified equilibration time and then measures the zeta potential via the CVI sensor. In addition, the DT-300 monitors pH and temperature continuously. A typical titration of this kind is shown in Figure 3, in which a titration has been made using hexametaphosphate with precipitated calcium carbonate at 3%vl.
The most complicated problem in titrating concentrated dispersions is mixing. Mixing is absolutely necessary for the successful titration. However, it becomes especially hard to mix in the ranges of instability. We know only one solution to this problem: pumping sample through the measuring chamber. Traditional propeller mixers do not work with the paste like samples. Pumping makes it possible to involve the complete sample whereas propeller mixing only agitates a localized sample volume. Pumping was observed to function properly only when the measuring chamber does not have hydrodynamically stagnated spaces. Otherwise, the presence of stagnated spaces results in deposit build-up and an interruption of sample flow.
Materials and experimental protocol.
The kaolin used in this study was obtained from the Engelhard Corporation and was catagorized as a fine grade crude with high iron content.Kaolin, a term used to describe deposits of kaolinite, is generally defined by a platelet crystal structure in which one of the dominant faces is made up of octahedral alumina and opposing side consists of tetrahedral silica.Particle aggregation occurs when the negative platelet face, negative due to isomorphic substitutions, interacts with the positive charge sites on the crystal edge, due to pH sensitive aluminol & silanol sites.The two dispersants used to study this aggregation phenomena were both common to the kaolin industry and consisted of 2.0 modulus silicate (Occidental Chemical Corporation) and sodium hexametaphosphate, SHMP (Albright & Wilson Americas Inc.).The 2.0 modulus being in reference to the average distribution of silicate species present: linear dimer, 3-D dimer and trimer.The 2.0 modulus silicate is expected to interact with the positive edge sites of the kaolin platelet through electrostatic interactions.The SHMP was a cyclic polyphosphate, which is expected to adsorb to the positive charges along the kaolin edges through both electrostatic and covalent bonding.
Results and discussion.
Titration of the kaolin EC1 slurry with SHMP revealed a strong pH dependence. Titration curve shifts depending on the initial pH value. This fact has been illustrated in Figure 4 for both zeta potential and pH. It is not surprising because pH is a strong charge factor for kaolin. For instance, Figure 7 presents pH titration of the 40%wt EC2 kaolin slurry. It is clear that zeta potential goes up with increasing pH.
Titration of EC1 kaolin slurry is a good example showing importance of various factors in addition to surfactant concentration. It is convenient to illustrate this complex titration using a
3-dimensional fingerprint. Figure 5 shows this fingerprint for the EC1 kaolin titration and illustrates the existence of an optimal concentration of surfactant. One can see that an increase in SHMP concentration leads to an eventual decrease inzeta potential. In this particular case, it is related to the increasing ionic strength and collapsing double layer.
Dependence of zeta potential on pH is an additional factor that might be exploited for reaching higherzeta potential values. From this viewpoint SHMP has a disadvantage because it reduces pH. Another surfactant, silicate, is more advantageous from the pH point of view due to the fact it increases slurry pH upon addition, see Figure 8. However, even the combined silicate-pH effect is not sufficient to reach zeta potentialvalues created with SHMP. The maximum value for silicate titration is -28 mV whereas SHMP yields -34 mV at maximum. SHMP is more efficient in terms of optimum concentration as well. The maximum value of thezeta potential can be reached by adding twice less SHMP (0.6% by kaolin weight) than silicate (1.3% by kaolin weight).
There is one more factor along the lines of mixing efficiency which affects stability of the kaolin dispersions: it is sonication. Apparently none of the tested chemical factors (pH, SHMP, silicate) destroys initial aggregates. These chemical factors create an environment which is potentially beneficial for gaining full stability, but in order to take advantage of this environment, one should apply a strong agitation to destroy aggregates. It turned out that mixing alone does reach minimum particle size. Only powerful sonication is able to break aggregates. This effect is illustrated in Figure 6 where sonication causes a large 5 mVjump in the zeta potential value. Actually, the results are somewhat misleading. Sonication does not affect surface charge but rather creates a new surface and reduces particle size. The appearance of the new surface with the samezeta potential leads to the larger CVI signal. This larger CVI signal can be interpreted as largerzeta potential if we keep the same particle size.To date, particle size was assumed to be 300 nm for all EC1 kaolin slurries.
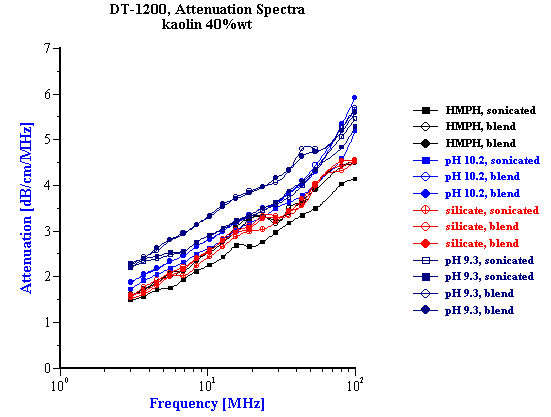
There is an opportunity to prove independently that sonication affects the particle size distribution. In order to do this, the authors made use of an Acoustic measurement which is a part of DT-1200. This acoustic sensor measures attenuation of the ultrasound. This attenuation spectra contains information about particle size. There are many examples of successful particle sizing using acoustics [3,4].
Table 1 . Median particle size calculated from attenuation spectra.
|
Chemical name |
Median log |
|---|---|
|
hexa, sonicated |
0.2122 |
|
hexa, blend |
0.2621 |
|
hexa, blend |
0.2621 |
|
pH 10.2, sonicated |
0.2658 |
|
pH 10.2, blend |
0.3002 |
|
pH 10.2, blend |
0.2978 |
|
pH 10.2, blend |
0.3017 |
|
silicate, sonicated |
0.2362 |
|
silicate, blend |
0.2627 |
|
silicate, blend |
0.2586 |
|
pH 9.3, sonicated |
0.3063 |
|
pH 9.3, blending |
0.3671 |
|
pH 9.3, blending |
0.366 |
Figure 9 shows the attenuation spectra measured for various kaolin EC1 slurries. Slurries with SHMP and silicate are prepared at the optimum surfactant concentrations. Corresponding median sizes are given in the Table 1. Here it is seen that the smallest size can be reached with SHMP after applying sonication. This confirms our observations made with electroacoustic measurement.
Conclusions
The electroacoustic zeta potential probe is a convenient tool for determining the optimal surfactant concentration corresponding to the saturated surface. It is able to perform this characterization in the intact concentrated dispersion eliminating dilution. A complete peptization requires additional sonication to destroy initial particle aggregates. Acoustic spectroscopy is an important addition to electroacoustic spectroscopy yielding information about the particle size distribution in concentrates and verifying the optimal surfactant level.
References
1.Lyklema, J. “Fundamentals of Interface and Colloid Science”, Volumes 1, Academic Press, 1993
2.Hunter, R.J. “Recent developments in the electroacoustic characterization of colloidal suspensions and emulsions”, Colloids and Surfaces, 141, 37-65 (1998)
3.Dukhin, A.S. and Goetz, J.P. “Acoustic and electroacoustic spectroscopy for characterizing concentrated dispersions and emulsions”, Advances in Colloid Interface Sci., 2000
4.Dukhin, A.S., Goetz, J.P., Wines, T.H. and Somasundaran, P. “Acoustic and electroacoustic Spectroscopy”, Colloids and Surfaces, A, 2000
5.Dispersion Technology Inc., Web site “www.dispersion.com”
6.Dukhin, A.S., Shilov, V.N., Ohshima, H., and Goetz, P.J. “Electroacoustics Phenomena in Concentrated Dispersions: New Theory and CVI Experiment”, Langmuir, 15,10 3445-3451, (1999)
7.Dukhin, A.S. and Goetz, P.J. “Method and device for characterizing particle size distribution and zeta potential in a concentrated system by means of Acoustic and Electroacoustic Spectroscopy”, US Patent, issued.
Figures Titles.
Figure 1. Equlibration of 3%vl zirconia slurry prepared with KCl 10-2 with pH adjusted initially to 4. It is seen that equlibration takes about 2 hours.
Figure 2. Titration of the 10%wt silica Ludox using 1 N HCl and KOH.
Figure 3. Titration of the3%vl PCC slurry with 0.1 g/g hexametaphosphate solution.
Figure 4. Titration of the 40%wt kaolin EC1 slurry using SHMP.
Figure 5. Titration z-pH-SHMP fingerprint of the 40%wt kaolin EC1 slurry.Scheme illustrating design of the electroacoustic sensor and definition of the element of the dispersion.
Figure 6. Effect of sonication on the EC1 40%wt kaolin titration with SHMP.
Figure 7. pH titration of the 40%wt EC2 kaolin slurry.
Figure 8. Titration of 40%wt EC1 kaolin slurry using silicate
Figure 9. Attenuation spectra measured for EC1 40%wt kaolin slurry stabilized either with pH, or SHMP, or silicate.
Figure 1.
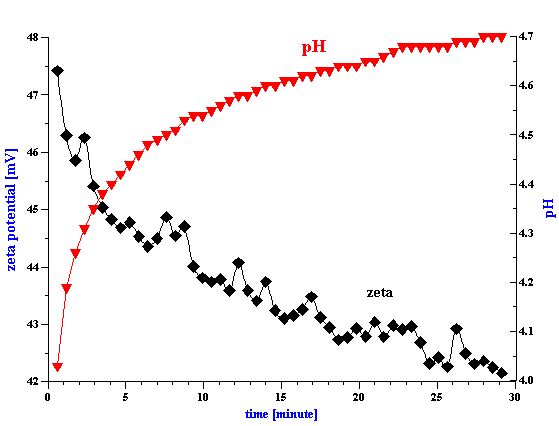
Figure 2.
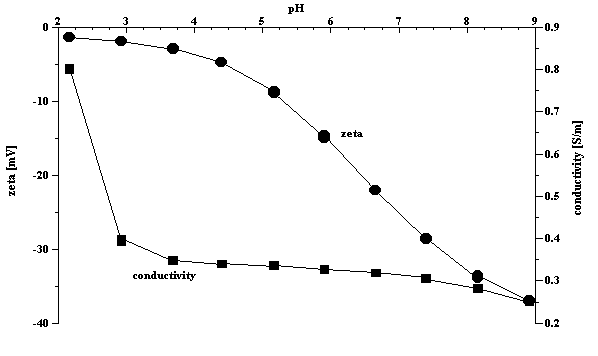
Figure 3
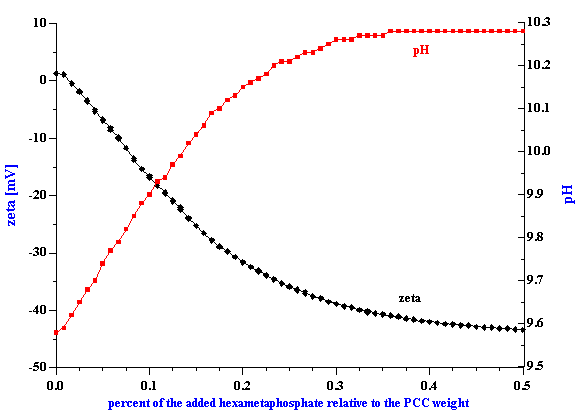
Figure 4.
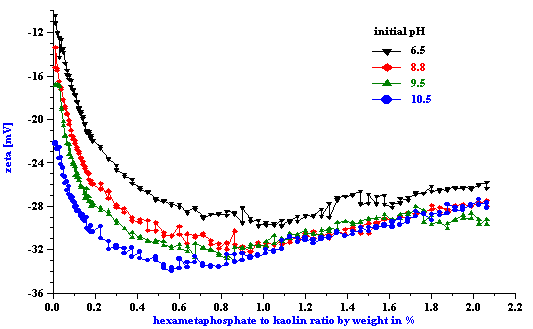
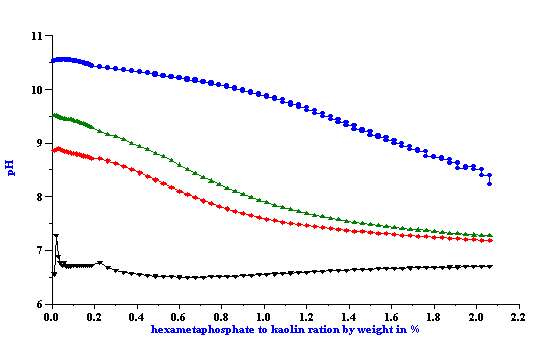
Figure 5.
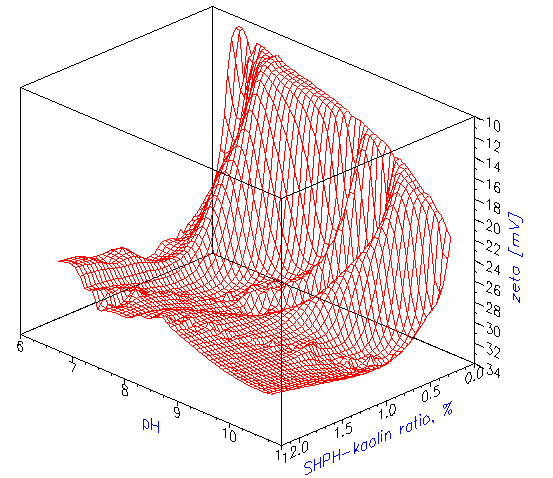
Figure 6.
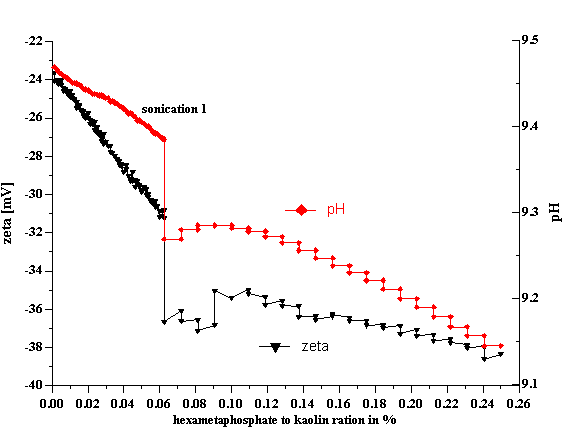
Figure 7.
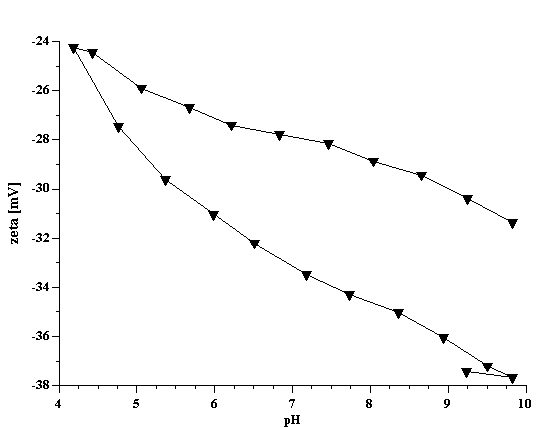
Figure 8
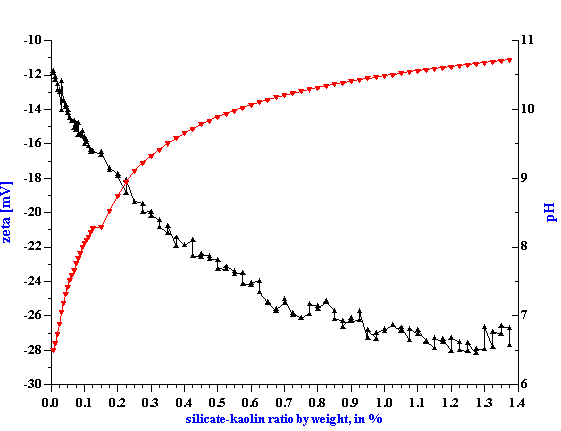
Figure 9.