Acoustics and Electroacoustics for Emulsions
( The full text of this paper will be appearing shortly in a major Encyclopedia of Emulsions )
The most well known acoustic theory for heterogeneous systems was developed by Epstein and Carhart [3], Allegra and Hawley [10]. This theory takes into account the four most important mechanisms (viscous, thermal, scattering and intrinsic) and is termed the “ECAH theory.” This theory describes attenuation for a monodisperse system of spherical particles and is valid only for dilute systems.
The term “monodisperse” assumes that all of the particles have the same diameter. Extensions of the ECAH theory to include polydispersity have typically assumed a simple linear superposition of the attenuation for each size fraction. The term “spherical” is used to denote that all calculations are performed assuming that each particle can be adequately represented as a sphere.
Most importantly, the term “dilute” is used to indicate that there is no consideration of particle-particle interactions. This fundamental limitation normally restricts the application of the resultant theory to dispersions with a volume fraction of less than a few volume percent. However, there is some evidence that the ECAH theory, in some very specific situations, does nevertheless provide a correct interpretation of experimental data, even for volume fractions as large as 30 %.
An early demonstration of the ability of the ECAH theory was provided by Allegra and Hawley. They observed almost perfect correlation between experiment and dilute case ECAH theory for several systems: a 20 % by volume toluene emulsion; a 10% by volume hexadecane emulsion; and a 10% by volume polystyrene latex. Similar work with emulsions by McClements [11,12] has provided similar results. The recent work by Holmes, Challis and Wedlock [13,14] shows good agreement between ECAH theory and experiments even for 30% by volume polystyrene latex.
A surprising absence of particle-particle interaction was observed with neoprene latex [15]. This experiment showed that attenuation is linear function of the volume fraction up to 30% for this particular system (Figure 1). This linearity is an indication that each particle fraction contributes to the total attenuation independently of other fractions, and is a superposition of individual contributions. Superposition works only when particle-particle interaction is insignificant.
It is important to note that the surprising validity of the dilute ECAH theory for moderately concentrated systems has only been demonstrated in systems where the “thermal losses” were dominant, such as emulsions and latex systems. In contrast, the solid rutile dispersion exhibits non-linearity of the attenuation above 10% by volume (Figure 2).
The difference between the “viscous depth” and the “thermal depth” provides an answer to the observed differences between emulsions and solid particle dispersions. These parameters characterize the penetration of the shear wave and thermal wave correspondingly into the liquid. Particles oscillating in the sound wave generate these waves which damp in the particle vicinity. The characteristic distance for the shear wave amplitude to decay is the “viscous depth” dv. The corresponding distance for the thermal wave is the “thermal depth” dt . The following expressions give these parameters values in the dilute systems:
where n is the kinematic viscosity, w is the frequency, r is the density, t is heat conductance, Cp is a heat capacity at constant pressure.
The relationship between dv and dt has been considered before. For instance, McClements plots “thermal depth” and “viscous depth” versus frequency [4]. It is easy to show that “viscous depth” is 2.6 time more than “thermal depth” in aqueous dispersions [15] . As a result, the particle viscous layers overlap at the lower volume fraction more than the particle thermal layers. Overlap of the boundary layers is the measure of the corresponding particle-particle interaction. There is no particle interaction when corresponding boundary layers are sufficiently separated.
Thus, an increase in the dispersed volume fraction for a given frequency first leads to the overlap of the viscous layers because they extend further into the liquid. Thermal layers overlap at higher volume fractions. This means that the particle hydrodynamic interaction becomes more important at the lower volume fractions than the particle thermodynamic interaction.
The 2.6 times difference between dv and dt leads to a big difference in the volume fractions corresponding to the beginning of the boundary layers overlap. The dilute case theory is valid for the volume fractions smaller than these critical volume fractions jv and jt . These critical volume fractions, jv and jt are functions of the frequency and particle size. These parameters are conventionally defined from the condition that the shortest distance between particle surfaces is equal to 2 dv or 2 dt. This definition gives the following expression for the ratio of the critical volume fractions in aqueous dispersions:
where a is particle radius in micron, f the frequency is in Mhz.
The ratio of the critical volume fractions depends on the frequency. For instance for neoprene latex, the critical “thermal” volume fraction is 10 times higher than the critical “viscous” volume fraction for 1 Mhz and only 3 times higher for 100 Mhz.
It is interesting that this important feature of the “thermal losses” works for almost all liquids. We have more than 100 liquids with their properties in our database. The core of this database is the well known paper by Anson and Chivers [16]. We can introduce a parameter referred to as “depth ratio”

This parameter is 2.6 for water as was mentioned before. Figure 3 shows values of this parameter for all liquids from our database relative to the viscous depth of water. It is seen that this parameter is even larger for many liquids.
Therefore “thermal losses” are much less sensitive to the particle – particle interaction than “viscous losses” for almost all known liquids. It makes ECAH theory valid in a much wider range of emulsion volume fractions than one would expect.
There is one more fortunate fact for ECAH theory that follows from the values of the liquid’s thermal properties. In general, ECAH theory requires information about three thermodynamic properties: thermal conductivity t, heat capacity Cp and thermal expansion b. It turns out that tand Cp are almost the same for all liquids except water. Figure 3 illustrate variation of these parameters for more than 100 liquids from our database. This reduces the number of required parameters to one – thermal expansion. This parameter plays the same role in “thermal losses” as density in “viscous losses.”
ECAH theory has a big disadvantage of being mathematically complex. It cannot be generalized for particle-particle interactions. This is not important as we have found for emulsions, but may be important for latex systems, and is certainly very important for high density contrast systems.There are two ways to simplify this theory using a restriction on the frequency and particle size. The first one is the so called “long wave requirement” [10] which requires the wave length of the sound wave l to be larger than particle radius a. This “long wave requirement” restricts particle size for a given set of frequencies. Our experience shows that particle size must be below 10 micron for the frequency range from 1 to 100 MHz. This restriction is helpful for characterizing small particles.
The long wave requirement provides a sufficient simplification of the theory for implementing particle-particle interaction. It has been done in the work [20] on the basis of the “coupled phase model”[18,19]. This new theory [20] works up to 40%volume even for heavy materials including rutile.
There is another approach to acoustics which employs a “short wave requirement.” It was introduced by Riebel [21]. This approach works only for large particles above 10 microns and requires limited input data about the sample. This theory may provide an important advantage in the case of emulsions and latex systems when the thermal expansion is not known.
There is opportunity in the future to create a mixed theory that could use a polynomial fit merging together “short” and “long” wave ranges theories. Such combined theory will be able to cover a complete particle size range from nanometers to millimeters for concentrated systems.
There are two recent developments in the theory of acoustics which deserved to be mentioned here. The first one is a theory of acoustics for flocculated emulsions [21]. It is based on ECAH theory but it uses in addition an “effective medium” approach for calculating thermal properties of the flocs. The success of this idea is related to the feature of the thermal losses that allows for insignificant particle – particle interactions even at high volume fractions. This mechanism of acoustic energy dissipation does not require relative motion of the particle and liquid. Spherical symmetrical oscillation is the major term in these kind of losses. This provides the opportunity to replace the floc with an imaginary particle assuming a proper choice of the thermal properties.
Another significant recent development is associated with the name of Samuel Temkin. He offers in his recent papers [22-23] a new approach to the acoustic theory. Instead of assuming a model dispersion consisting of spherical particles in a Newtonian liquid, he suggests that the thermodynamic approach be explored as far as possible. This new theory operates with notions of particle velocities and temperature fluctuations. This very promising theory yields some unusual results [22-23]. It has not been yet used, as far as we know, in commercially available instruments.
Bubbles Problem:
One of the experimental problems that may affect acoustics is the presence of air bubbles during measurements. While bubbles will affect sound attenuation and speed, it is worth considering how much of an effect they really have and whether the bubbles will detract from the acoustic techniques:
1. It has been determined that acoustic spectra is affected by bubbles. An acoustic theory describing sound propagation through bubbly liquid has been created by Foldy in 1944 [30], and confirmed experimentally in 1940-1950[31,32].
2. Contribution of bubbles to sound speed and attenuation depends on the bubble size and sound frequency. For instance, a 100 micron bubble has a resonance frequency of about 60 KHz. This frequency is reciprocally proportional to the bubble diameter. A bubble of 10 micron diameter will have a resonance frequency of about 0.6 MHz.
3. Acoustic spectroscopy of dispersed systems operates with frequencies above 1 MHz and usually up to 100 MHz. The size of the bubbles must be well below 10 micron in order to affect the complete frequency range of acoustic spectrometer.
4. Bubbles with sizes below 10 micron are very unstable as is known from general colloid chemistry and the theory of flotation. “Colloid-sized gas bubbles have astonishingly short lifetimes, normally between 1 ms and 1 ms.” [33]. They simply dissolve in liquid because of high curvature.
Bubbles can only affect the low frequency part of the acoustic spectra below 10 MHz. The frequency range from 10 to 100 MHz is available for particle characterization even in the bubbly liquids. Acoustic spectrometer can do both, sense bubbles and characterize particle size. We can confirm this conclusion with thousands of measurements performed with hundreds of different systems. Sensitivity to bubbles, in fact, is an important advantage of acoustics over electroacoustrics. The presence of bubbles may affect the properties of the solid dispersed phase. For instance, bubbles can be centers of aggregation which makes them an important stability factor.
Measuring Technique
Currently, there are three acoustic spectrometers on the market: Ultrasizer of Malvern, Opus of Sympatec and DT-100 of Dispersion Technology. All of them claim to be able to characterize emulsions in the wide droplet size range. There are some major differences between them. For instance Opus was designed initially for large particles only because it employs the “short wavelength requirement” [21].
There are also two electroacoustic spectrometers on the market: the Acoustosizer of Colloidal Dynamics and the DT-300 of Dispersion Technology. There is only one instrument which provides both features, acoustics and electroacoustics together, and this is the DT-1200 Acoustic and Electroacoustic Spectrometer of Dispersion Technology.
Comparison of the different instruments lies beyond the scope of this review. The DT-1200 was used for all experiments described in this work. A description of this instrument is given below.
Applications for Emulsions
There are many instances of successful characterization of the particle size distribution and zeta potential of emulsion droplets. There are two quite representative reviews of these experiments published by McClements [4] (acoustics) and Hunter [8] (electroacoustics).
Some results of our recent investigation are presented that were not published before. Various factors that affected stability, size and zeta potential of the emulsion droplets were investigated.
The first experiment was a repetition to some extent of McClements work with hexadecane in water emulsions. An emulsion was prepared following McClements work [37]. containing 25% by weight of hexadecane in water. The measured attenuation spectra (Figure 11) exhibited a pronounced time dependence. The sound attenuation was found to increase in magnitude as time elapsed. This increase in the attenuation corresponded to the droplet population becoming smaller in size. The median droplet size was reduced by almost two times during a half an hour experiment. This reduction of the droplet size was caused by the shear induced by a magnetic stirrer used in the sample chamber of the DT-1200 instrument. As the emulsion was stirred, the larger drops were fragmented into smaller droplets
Another important parameter affecting emulsions is the surfactant concentration that affects surface chemistry. This factor was tested for reverse water-in-oil emulsion. The oil phase was simply commercially available car lubricating oil diluted twice with paint thinner in order to reduce the viscosity of the final sample. Figure 12 illustrates results for emulsions prepared with 6% by weight of water.
This Figure shows the attenuation spectra for three samples. The first sample was a pure oil phase and exhibited the lowest attenuation. It is important to measure the attenuation of the pure dispersion medium when a new liquid is evaluated. In this particular case, the intrinsic attenuation of the oil phase was almost 150 dB/cm at 100 MHz which is more than seven times higher than for water. This intrinsic attenuation is a very important contribution to the attenuation of ultrasound in emulsions. It is the background for characterizing emulsion system.
The emulsion without added surfactant was measured twice with two different sample loads. As the water content was increased the attenuation became greater in magnitude. For this system, the attenuation was found to be quite stable with time. Addition of 1% by weight AOT (sodium bis 2-ethylhexyl sulfosuccinate) changed the attenuation spectra dramatically. This new emulsion with modified surface chemistry was measured two times in order to show reproducibility. The corresponding particle size distribution is shown in Figure 12 and indicates that the AOT converted the regular emulsion into a microemulsion as one could expect.
These experiments proved that the acoustic technique is capable of characterizing the particle size distribution of relatively stable emulsions. In many instances emulsions are found that are not stable at the dispersed volume concentration required to obtain sufficient attenuation signals (usually above 0.5 %). Hazy water in fuel emulsions (diesel, jet fuel, gasoline) may exist at low water concentrations of only a few 100 ppmv (0.01%) of dispersed water. Attempts at characterizing these systems without added surfactant resulted in unstable attenuation spectra and water droplets were discovered to separate from the bulk emulsion and settle out on the chamber walls. This problem is less important for thermodynamically stable microemulsions.
Microemulsions
The mixture of heptane with water and AOT is a classic three component system. It has been widely studied due to a number of interesting features it exhibits. This system forms stable reverse microemulsions (water in oil) without the complication introduced by additional co-surfactant. Such a co-surfactant (usually alcohol) is required by many other reverse microemulsion systems. This simplification makes the alkane/water/AOT system a model for studying reverse microemulsions.
There have been many studies devoted to characterization of these practically important systems. Reverse emulsion droplets have been used as chemical micro reactors to produce nano size inorganic and polymer particles with special properties that are not found in the bulk form [38-42]. These microemulsion systems have also been a topic of research for biological systems and the AOT head groups have been found to influence the conformation of proteins and increase enzyme activity [43-46]. The unique environment created in the small water pools of swollen reverse micelles allows for increased chemical reactivity. The increase in surface area with decrease in size of the droplets also can significantly increase reactivity by allowing greater contact of immiscible reactants.
There have been many attempts to measure the droplet size of this microemulsion. Several different techniques were used: PCS (47-52), classic light scattering (49,51,53), SANS (54-56), SAXS (48,57,58), ultracentrifugation (46,50,53), and viscosity (48,50,53). It was observed that the heptane/water/AOT microemulsions have water pools with diameters ranging from two nanometers up to thirty nanometers. The water drops are encapsulated by the AOT surfactant so that virtually all of the AOT is located at the interface shell. The size of the water droplets can be conveniently altered by adjusting the molar ratios of water to surfactant designated as R ([H2O]/ [AOT]). At low R values (R < 10) the water is strongly bound to the AOT surfactant polar head groups and exhibits unique characteristics different from bulk water (53). At higher water ratios, (R> 20), free water is predominant in the swollen reverse micellular solutions, and at approximately R = 60, the system undergoes a transition from a transparent microemulsion into an unstable turbid macroemulsion. This macroemulsion separates on standing into a clear upper phase and a turbid lower phase.
The increase in droplet size and phase boundary can also be achieved by raising the temperature up to a critical temperature of 55 C. In addition this system has been found to exhibit an electrical percolation threshold whereby the conductivity increases by several orders of magnitude by either varying the R ratio or increasing the temperature (56,57,59,60). Despite all these efforts, there still remain questions regarding the polydispersity of the water droplets, and few studies are available above the R value of 60 where a turbid macroemulsion state exists.
Acoustic spectroscopy offers a new opportunity for characterizing these complicated systems. Details of this experiment are presented in the paper [61]. The reverse microemulsions were prepared by first making a 0.1 molar AOT in heptane solution (6.1% wt. AOT). The heptane was obtained from Sigma as HPLC grade (99+ % purity). Known amounts of 18 megohm-cm water were added to the AOT-heptane solution using a 1 ml total volume, graduated glass syringe and then shaken for 30 seconds in Teflon capped glass bottles. The shaking action was required to overcome an energy barrier to distribute the water into the nano-sized droplets, as it could not be achieved using a magnetic stirrer.
In all cases, the reported R values are based on the added water, and were not corrected for any residual water that may have been in the dried AOT or heptane solvent. Karl Fischer analysis of the AOT-heptane solutions before the addition of water resulted in a R value of 0.4. This amount was considered to be negligible.
Measurements were made starting with the pure water and heptane and then the AOT-heptane sample with no added water (R = 0). The sample fluid was removed from the instrument cell and placed in a glass bottle with a Teflon cap. Additional water was titrated and the microemulsion was shaken for 30 seconds before being placed back into the instrument cell. The sample cell contained a cover to prevent evaporation of the solvents. The samples were visually inspected for clarity and rheological properties for each R value. These steps were repeated for increasing water weight fraction or R ratios up to R =100. At R ³ 60 the microemulsions became turbid. At R > 80, the emulsions became distinctly more viscous.
The weight fractions of the dispersed phase were calculated for water only without including the AOT. Each trial run lasted approximately 5-10 minutes with the temperature varied from 25 – 27 °C. A separate microemulsion sample for R= 40 was made up a few days prior to the first study. For the R=70 sample, a second acoustic measurement was made with the same sample used for the first study. The complete set of experiments for water, heptane, and the reverse microemulsions from R = 0 to 100 was repeated to evaluate the reproducibility.
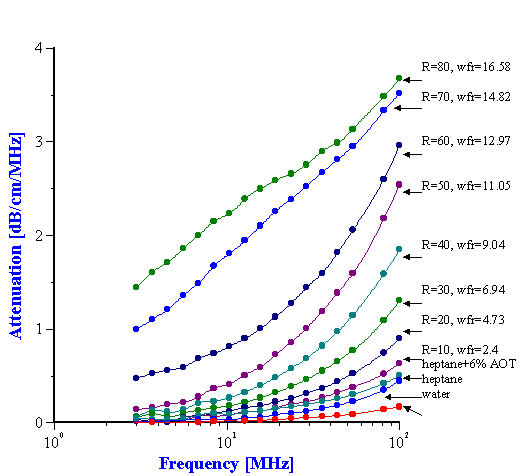
Attenuation spectra measured in the first run up to R=80 are presented in Figure 13. The results for R = 90 and R = 100 are not reported because they were found to vary appreciably. As the water concentration is increased, the attenuation spectrum rises in intensity and there is a distinct jump in the attenuation spectrum from R= 50 to R = 60 in the low frequency range. This discontinuity is also reflected in the visual appearance as at R= 60 the system becomes turbid. The smooth shape of the attenuation curve also changes at R > 60. The stability and reproducibility of the system was questioned due to the irregular nature of the curve so the experiment at R = 70 was repeated and gave almost identical results. An additional experiment was run at R=40 for a separate microemulsion prepared a few days earlier. This showed excellent agreement with the results for freshly titrated microemulsion.
For R values > 70, an increase in the viscosity and a decrease in the reproducibility of the attenuation measurement were observed. This could be due to the failure of the model for this system as a collection of separate droplets at high R values.
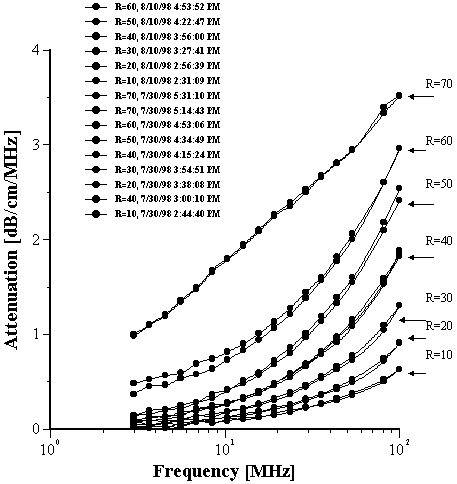
A second set of experiments was run to check the reproducibility. The results of both sets of experiments up to R = 60 are given in Figure 14. It can be seen that the error related to the reproducibility is much smaller than the difference between attenuation spectra for the different R values. This demonstrates that the variation of attenuation reflects changes in the sample properties of water weight fraction and droplets size. The sound attenuation at R values above 60 were not as reproducible, but did give the same form of a bimodal distribution as the best fit for the experimental data.
The two lowest attenuation curves correspond to the attenuation in the two pure liquids; water and heptane. This attenuation is associated with oscillation of liquid molecules in the sound field. If these two liquids are soluble in each other, the total attenuation of the mixture would lie between these two lowest attenuation curves. But it can be seen that the attenuation of the mixture is much higher than that of the pure liquids. The increase in attenuation, therefore, is due to this heterogeneity of the water in the heptane system. The extra attenuation is caused by motion of droplets, not separate molecules. The scale factor (size of droplets) corresponding to this attenuation is much higher than that for pure liquids (size of molecules).
The current system contains a third component – AOT. A question arises on the contribution of AOT to the measured attenuation. In order to answer this question, measurements were done on a mixture of 6.1% wt. AOT in heptane (R = 0). It is the third smallest attenuation curve on Figure 13. It is seen that attenuation increases somewhat due to AOT. However, this increase is less than the extra attenuation produced by water droplets. The small increase in attenuation is attributed to AOT micelles. Unfortunately thermal properties of the AOT as a liquid phase are not known and the size of these micelles could not be calculated.
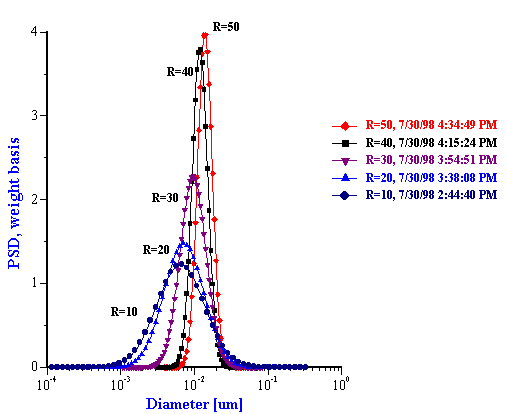
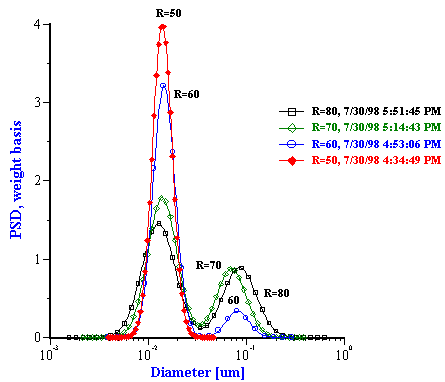
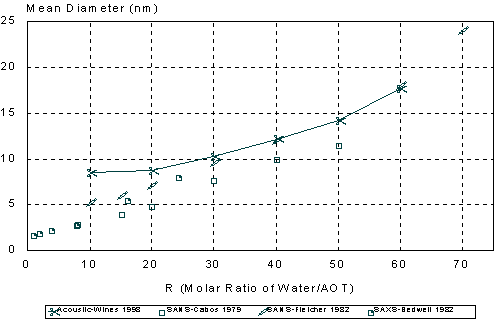
The particle size distributions corresponding to the measured attenuation spectra are presented in Figure 15. It can be seen that the distribution becomes bimodal for R ³ 60 that coincides with the onset of turbidity. It is to be noted that such a conclusion could not easily be arrived at with other techniques. However, Figure 15 illustrates a peculiarity of this system that can be compared with independent data from literature: mean particle size increases with R almost in a linear fashion. This dependence becomes apparent when mean size is plotted as a function of R as in Figure 16.
It is seen that mean particle size measured using acoustic spectroscopy are in good agreement with those obtained independently using the neutron scattering (SANS) and X-ray scattering (SAXS) techniques (43,48,54) for R values ranging from 20 to 60. A simple theory based on equi-partition of water and surfactant (36) can reasonably explain the observed linear dependence.
At R = 10 the acoustic method gave a slightly larger diameter than expected. This could be due to the constrained state of the “bound water” in the swollen reverse micelles. The water under these conditions may exhibit different thermal properties than the bulk water used in the particle size calculations. Also at the low R values (R < 10 or < 2.4% water), the attenuation spectrum is not very large as compared to the background heptane signal. Contribution of droplets to attenuation spectrum then may become too low to be reliably distinguished from the background signal coming from heptane molecules and AOT micelles.
In addition to particle size, the Colloid Vibration Current was also measured for calculating zeta potential. The results are presented in Figure 17 and the zeta potential was found to depend on the water content. An increased concentration of water resulted in higher zeta potentials. However, the water content was not the most important factor. This experiment was performed at two different AOT concentrations and the ratio of water to AOT (R) was discovered to be the key parameter. When the zeta potential was plotted versus the R values, the same curve was obtained for both AOT concentrations. This demonstrates that the zeta potential depends on the degree of the water surface coverage by AOT molecules.
This experiment allows us to suggest a mechanism of electric charge formation on the surface of the water droplets in the oil phase. This is a field of great interest in modern emulsion science. According to our experiment, the zeta potential appears when there is a deficit of AOT molecules for complete coverage of the water droplets. As more elements of the water phase become exposed to the oil, higher values of the zeta potential are measured. The water phase also contains a considerable concentration of sodium ions that originate from the AOT and serve as counter-ions to the negatively charged sulfosuccinate head groups. As a result of decreased surface coverage, the water droplets gain surface charge when they are in contact with oil. This surface charge can appear because of ion exchange between the water and oil phase caused by the difference in standard chemical potentials in each phase. Molecules of AOT do not create surface charge, but conversely screen the surface charge of the initial water droplets. At the same time these AOT molecules change the interfacial tension creating conditions for a thermodynamically stable microemulsion. This is only a hypothesis so far and further investigation is required for confirmation.
Latex Systems
There have been many successful experiments that have characterized latex systems using both acoustics and electroacoustics. For instance, Allegra and Hawley measured polystyrene latex. We measured Standard Dow latex which is also polystyrene in nature (see above). There is another successful application, this time with neoprene latex, which is described in the paper [15].
This low density latex dispersion (Neoprene Latex 735A) is designed by DuPont as a wet-end additive to fibrous slurries. The fraction of the latex in the initial dispersion is 42.8% by weight (37.3% by volume). The pH value at 250C is 11.5. The physical properties of the neoprene (slow crystallizing polychloroprene homopolymer) have been measured in the DuPont laboratories many years ago. This data is summarized in the monograph “The Neoprenes” [62].
A dilution test was made with this latex using distilled water with a pH adjusted to 11.5 using 1N potassium hydroxide. The samples were prepared with the various dispersed concentrations (1.4, 4, 6.6, 13, 19.4, 25.6, 31.6 and 37.5 % by weight) by adding diluting solution to the initial neoprene latex.
Interpretation of the attenuation spectra requires information about the entire particle size spectra. A lognormal approximation was used with a median size of 0.16 micron and a standard deviation of 6% for the PSD measured with hydrodynamic chromatography.
The experimental data collected by the acoustic method with the neoprene latex provided an opportunity to check the validity of the ECAH theory when thermal losses were the dominant mechanism of the sound attenuation (see Figure 18). In order to calculate the theoretical attenuation spectra, information is required about the particle size, thermodynamic properties of the dispersed phase and dispersion medium materials as well as “partial intrinsic attenuations.” Fortunately, all of the required parameters are available in this case. The approximate thermodynamic properties of the neoprene are known from the independent investigation performed by DuPont.
Figure 19 shows experimental and theoretical attenuation spectra for all the measured volume fractions. It is seen that the correlation between theory and experiment is very good up to 37.5% by weight (32.4% by volume).
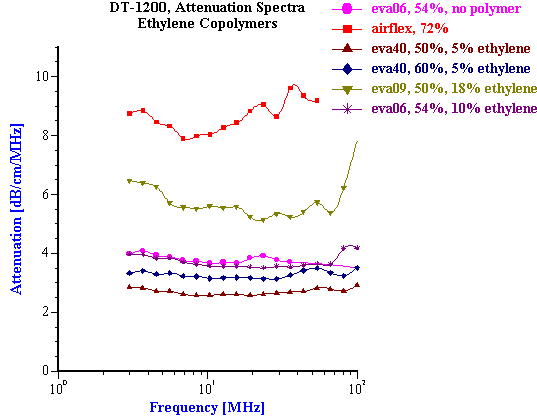
These successful examples of characterizing latex systems are possible only when thermal expansion coefficients are known. Unfortunately, this parameter is not known for many latex polymers. This problem becomes even more complicated for latex systems than for emulsions because the value of the thermal expansion depends strongly on the chemical composition of the polymer. Figure 20 illustrates this fact for several ethylene copolymers with different ethylene content. Variation of the ethylene content from 5% to 10% was found to causes significant change in attenuation spectra. This change is associated with the thermal expansion coefficient, but not the particle size.
The uncertainty related with the thermal expansion coefficient makes latex systems the most complicated systems for acoustics. This is important to keep in mind for testing a particular model of an acoustic instrument. Latex dispersions that are used as standards for light based methods should be used with caution as in many cases the thermal expansion properties of these standards are not well known.
Conclusions
We hope that we proved with this short review that acoustics and electroacoustics can be extremely helpful in characterizing particle size, zeta potential and some other properties of concentrated emulsions, microemulsions and latex systems. Both methods are commercially available already. There are still some problems with theoretical background for electroacoustics but analysis of the literature shows gradual improvement in this field.
The combination of the acoustic and electroacoustic spectroscopy provides a much more reliable and complete characterization of the disperse system than either one of those spectroscopes separately. Electroacoustic phenomena is more complicated to be interpreted when comparing the acoustic ones because an additional field (electric) is involved. This problem becomes even more pronounced for a concentrated system. It makes acoustics favorable for characterizing particle size, whereas electroacoustics yields electric surface properties.
We believe that these ultrasound based techniques is a very valuable addition to the traditional colloid chemical arsenal of tools designed for characterizing surface phenomena.
REFERENCES
1. Pellam, J.R. and Galt, J.K. “Ultrasonic propagation in liquids:Application of pulse technique to velocity and absorption measurement at 15 Magacycles”, J. of Chemical Physics, 14, 10 , 608-613 (1946)
2. Sewell, C.T.J., “The extinction of sound in a viscous atmosphere by small obstacles of cylindrical and spherical form”, PhilTrans.Roy.Soc., London, 210, 239-270 (1910)
3. Epstein, P.S. and Carhart R.R., “The Absorption of Sound in Suspensions and Emulsions”, J.of Acoust.Soc.Amer., 25, 3, 553-565 (1953)
4. McClements, D.J. “Ultrasonic Characterization of Emulsions and Suspensions”, Adv. in Colloid and Interface Sci., 37 (1991) 33-72
5. “Ultrasonic and Dielectric characterization techniques for suspended particultes”, Ed. V.A.Hackley and J.Texter, The American Chemical Society, Ohio, (1998)
6. Lyklema, J. “Fundamentals of Interface and Colloid Science”, Volumes 1, Academic Press, 1993
7. Hunter, R.J. “Foundations of Collid Science”, Oxford University Press, Oxford, 1989
8. Hunter, R.J. “Review. Recent developments in the electroacoustic characterization of colloidal suspensions and emulsions”, Colloids and Surfaces, 141, 37-65 (1998)
9. Strout, T.A., “Attenuation of Sound in High-Concentration Suspensions:Development and Application of an Oscillatory Cell Model”, A Thesis, The University of Maine, 1991
10. Allegra, J.R. and Hawley, S.A. “Attenuation of Sound in Suspensions and Emulsions:Theory and Experiments”, J.Acoust.Soc.Amer., 51, 1545-1564 (1972)
11. McClements, J.D. “Ultrasonic Determination of Depletion Flocculation in Oil-in-Water Emulsions Containing a Non-Ionic Surfactant”, Colloids and Surfaces, 90, 25-35 (1994)
12. McClements, D.J. “Comparison of Multiple Scattering Theories with Experimental Measurements in Emulsions” The Journal of the Acoustical Society of America, vol.91, 2, pp. 849-854, February 1992
13. Holmes, A.K., Challis, R.E. and Wedlock, D.J. “A Wide-Bandwidth Study of Ultrasound Velocity and Attenuation in Suspensions: Comparison of Theory with Experimental Measurements”, J.Colloid and Interface Sci., 156, 261-269 (1993)
14. Holmes, A.K., Challis, R.E. and Wedlock, D.J. “A Wide-Bandwidth Ultrasonic Study of Suspensions: The Variation of Velocity and Attenuation with Particle Size”, J.Colloid and Interface Sci., 168, 339-348 (1994)
15. A.S.Dukhin, P.J.Goetz. and C.W.Hamlet, “Acoustic Spectroscopy for Concentrated Polydisperse Colloids with Low Density Contrast”, Langmuir, 12 [21] 4998-5004 (1996)
16. Anson, L.W. and Chivers, R.C. “Thermal effects in the attenuation of ultrasound in dilute suspensions for low values of acoustic radius”, Ultrasonic, 28, 16-25 (1990)
17. Harker, A.H. and Temple, J.A.G., “Velocity and Attenuation of Ultrasound in Suspensions of Particles in Fluids”, J.Phys.D.:Appl.Phys., 21, 1576-1588 (1988)
18. Gibson, R.L. and Toksoz, M.N., “Viscous Attenuation of Acoustic Waves in Suspensions”, J.Acoust.Soc.Amer., 85, 1925-1934 (1989)
19. A.S.Dukhin and P.J.Goetz, “Acoustic Spectroscopy for Concentrated Polydisperse Colloids with High Density Contrast”, Langmuir, 12 [21] 4987-4997 (1996)
20. Riebel, U. et al. “The Fundamentals of Particle Size Analysis by Means of Ultrasonic Spectrometry” Part.Part.Syst.Charact., vol.6, pp.135-143, 1989
21. Chanamai, R., Coupland, J.N. and McClements, D.J. “Effect of Temperature on the Ultrasonic Properties of Oil-in-Water Emulsions”, Colloids and Surfaces, 139, 241-250 (1998)
22. Temkin, S. “Sound Speed in Suspensions in Thermodynamic Equilibrium” Phys.Fluids, vol. 4, 11, pp.2399-2409, November 1992
23. Temkin, S. “Sound Propagation in Dilute Suspensions of Rigid Particles” The Journal of the Acoustical Society of America, vol. 103, 2, pp.838-849, February 1998
24. O’Brien, R.W. “Electro-acoustic Effects in a dilute Suspension of Spherical Particles”, J.Fluid Mech., 190, 71-86 (1988)
25. O’Brien, R.W. “Determination of Particle Size and Electric Charge”, US Patent 5,059,909, Oct.22, 1991.
26. Dukhin, A. S., Shilov, V.N. and Borkovskaya Yu. “Dynamic Electrophoretic Mobility in Concentrated Dispersed Systems. Cell Model.”, Langmuir, accepted.
27. Dukhin, A.S., Ohshima, H., Shilov, V.N. and Goetz, P.J. “Electroacoustics for Concentrated Dispersions”, Langmuir, accepted
28. Dukhin, A.S., Shilov, V.N, Ohshima, H., “Electroacoustics Phenomena in Concentrated Dispersions.Theory”, Langmuir, submitted
29. Foldy, L.L “Propagation of sound through a liquid containing bubbles”, OSRD Report No.6.1-sr1130-1378, (1944)
30. Carnstein, E.L. and Foldy, L.L “Propagation of sound through a liquid containing bubbles”, J. of Acoustic Society of America, 19, 3, 481- 499 (1947)
31. Fox, F.E., Curley S.R. and Larson, G.S. “Phase velocity and absorption measurement in water containing air bubbles” J. of Acoustic Society of America, 27, 3, 534-539 (1957)
32. Ljunggren, S. and Eriksson, J.C. “The lifetime of a colloid sized gas bubble in water and the cause of the hydrophobic attraction”, Colloids and Surfaces, 129-130, 151-155 (1997)
33. Schaaffs, W. “Molecular acoustics”, vol.5 of “Atomic and Molecular Physics”, Ed.K.Hellwege, Landolt-Bornstein, Berlin-NY, 1967
34. Waterman, P.S. and Truell, R. J.Math.Phys., 2, 512 (1961)
35. R.R.Irani and C.F.Callis, “Particle Size: Measurement, Interpretation and Application”, John Wiley & Sons, NY-London, 1971
36. A.S.Dukhin and P.J.Goetz, “Characterization of aggregation phenomena by means of acoustic and electroacoustic spectroscopy”, Colloids and Surfaces, 144, 49-58(1998)
37. Dickinson, E., McClements, D.J. and Povey, M.J.W. “Ultrasonic investigation of the particle size dependence of crystallization in n-hexadecane-in-water emulsions”, J.Colloid and Interface Sci., 142,1, 103-110 (1991)
38. Wilcoxon, J.P. and Williamson, R.L. in “Material Research Society Symposium Proc., Macromolecular liquids” (C.R. Safinya, S.A.Safran, and P.A. Pincus, Eds.) Vol. 177, Materials Research Soc., Pittsburg, (1990)
39. Candau, F. , in “Material Research Society Symposium Proceedings: Macromolecular Liquids” (C.R. Safinya, S.A. Safran, and P.A. Pincus, Eds.), Vol.177. Materials Research Society, Pittsburgh, 1990.
40. Motte, L., Lebrun, A., and Pileni, M. P., Progr. Coll. Polym. Sci 89, 99 (1992).
41. Ichinohe, D., Arai, T. and Kise, H., Synthetic Metals 84, 75 (1997).
42. Schubert, K.V., Lusvardi, K.M., and Kaler, E.W., Coll. Polym. Sci. 274, 875 (1996).
43. Menger, F. M., and Yamada, K., J. Am.Chem. Soc. 101, 22, 6731 (1979).
44. Chatenay, D., Urbach, W., Cazabat , A.M., Vacher, M., and Waks, M., Biophysics Journal 48, 893 (1985).
45. Timmins, G.S., Davies, M.J., Gilbert, B.C., and Caldararu, H., J. Chem. Soc. Faraday Trans. 90, 18, 2643 (1994).
46. Kabanov, A.V., Makromol. Chem., Macromol. Symp. 44, 253 (1991).
47. Crupi, V., Maisano, G., Majolino, D., Ponterio, R., Villari, V., and Caponetti, E., J. Mol. Struct. 383, 171 (1996).
48. Bedwell B., and Gulari, E., in “Solution Behavior of Surfactants” (K.L. Mittal, Ed.), Vol. 2., Plenum Press, New York, 1982.
49. Gulari, E., Bedwell, B. and Alkhafaji, S., J. Colloid Interface Sci., 77,1, 202 (1980).
50. Zulauf, M., and Eicke, H.-F., J. Phys. Chem., 83, 4, 480 (1979).
51. Eicke, H.-F. in “Microemulsions” (I.D. Rob,Ed.), p.10, Plenum Press, New York, 1982.
52. Nicholson, J.D., Doherty, J.V., and Clarke, J.H.R. in “Microemulsions” (I.D. Rob, Ed.), p. 33, Plenum Press, New York, 1982.
53. Eicke, H.-F., and Rehak, J., Helv. Chim. Acta, 59, 8, 2883 (1976) 2883.
54. Fletcher, P.D.I., Robinson, B.H., Bermejo-Barrera, F., Oakenfull, D.G., Dore, J.C., and Steytler, D.C. in “Microemulsions” (I.D. Rob, Ed.), p. 221, Plenum Press, New York, 1982.
55. Cabos, P.C., and Delord, P., J. App. Cryst. 12, 502 (1979).
56. Radiman, S., Fountain, L.E., Toprakcioglu, C., de Vallera, A., and Chieux, P., Progr. Coll. Polym. Sci. 81, 54 (1990).
57. Huruguen, J.P., Zemb, T., and Pileni, M.P., Progr. Coll. Polym. Sci. 89, 39 (1992).
58. Pileni, M. P., Zemb, T. and Petit, C., Chem. Phys. Lett. 118, 4, 414 (1985).
59. Sager, W., Sun, W., and Eicke, H.-F., Progr. Coll. Polym. Sci. 89, 284 (1992) 284.
60. Safran, S.A., Grest, G.S., and Bug , A.L.R. in “Microemulsion Systems” (H. L. Rosano and M. Clause, Eds.), p. 235, Marcel Dekker, New York, 1987.
61. Wines, T.H., Dukhin A.S. and Somasundaran, P. “Acoustic spectroscopy for characterizing heptane/water/AOT reverse microemulsion”, Colloids and Surfaces, 1999, accepted
62. Catton, N.L., “The Neoprenes”, Rubber Chemical Division, E.I.Du Pont De Nemours & Co., Wilmington, Delaware (1953)
LIST OF TITLES
Figure 1. Dependence of the attenuation in the neoprene latex at the frequency 15 MHz on the dispersed system weight fraction. Corresponding volume fractions in % are shown as the data points labels
Figure 2. Dependence of the attenuation in the rutile dispersion (rutile R-746 by DuPont) at the frequency 15 MHz on the dispersed system weight fraction. Corresponding volume fractions in % are shown as the data points labels.
Figure 3. Thermal properties of various liquids.
Figure 4. Attenuation spectra and droplet size distribution of 40% water in cyclo methicone emulsion.
Figure 5.
Figure 6. Sound speed for silica Ludox TM versus volume fraction. Equilibrium dilution using dyalysis. Triangles-theory according to the Wood expression, diamonds- experiment.
Figure 7. Attenuation of the multiple measurements with alumina Sumitomo AA-2 and silica Ludox TM at 10%wt.
Figure 8. Multiple zeta potential measurements of 10%wt silica Ludox.
Figure 9. Titration of silica Ludox TM at 10%wt and chemical-mechanical polishing silica ECC.
Figure 10. Particle size distribution of the silica quartz BCR. Acoustic measurement has been performed with the 11%wt in ethanol.
Figure 11. Attenuation and corresponding particle size distribution of 25%wt hexadecane-in-water emulsion.
Figure 12. Attenuation and corresponding particle size distribution of 6%wt water-in-car oil emulsion and microemulsion caused by AOT.
Figure 13. Acoustic attenuation spectra measured for water/AOT/heptane system for different water to AOT ratios R.
Figure 14. Reproducibility test of the attenuation measurement.
Figure 15. Drop size distribution for varying R [H20]/[AOT] from 10 to 50 and from 50 to 80.
Figure 16. Comparison of mean droplet size measured using acoustic spectroscopy, neutron scattering and X-ray scattering.
Figure 17. Zeta potential measured electroacoustically for water droplets covered with AOT in heptane versus water content.
Figure 18. Theoretical attenuation spectra for the various mechanisms of the acoustic energy losses. Volume fraction is 10%vl, particle size is 0.16 micron.
Figure 19. Experimental and theoretical attenuation spectra for neoprene latex for the weight fractions indicated in the legends.
Figure 20. Attenuation spectra for latex dispersions with different content of ethylene.
Figure 1.
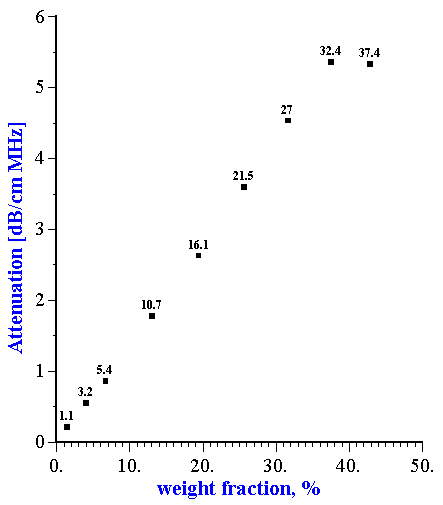
Figure 2.
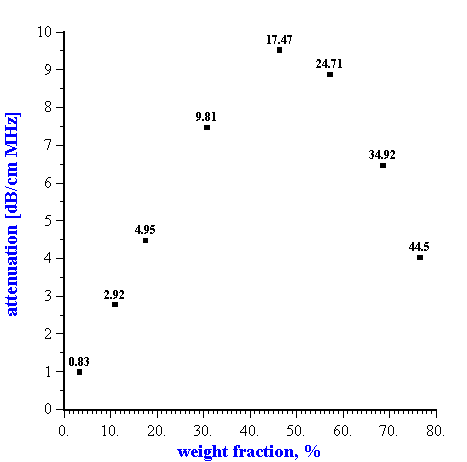
Figure 3.
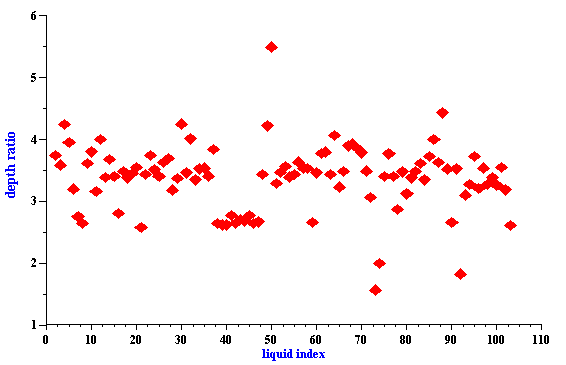
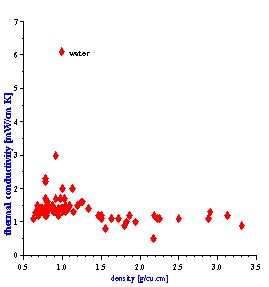
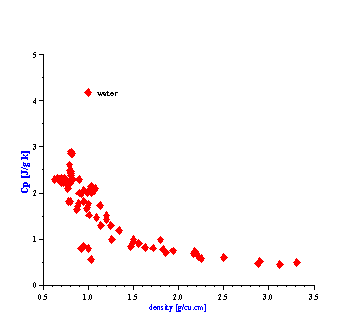
Figure 4.
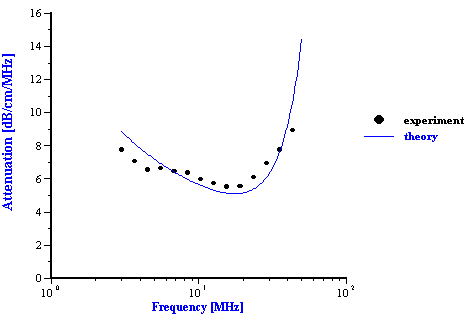
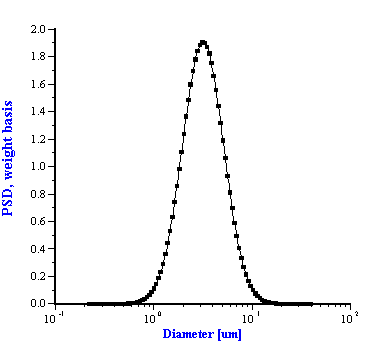
Figure 5.
Sound speed
Figure 6.
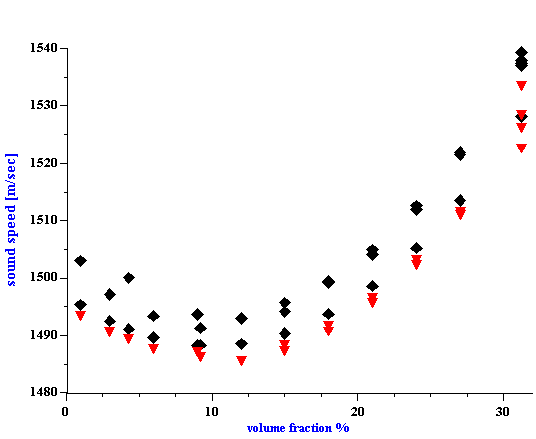
Figure 7. 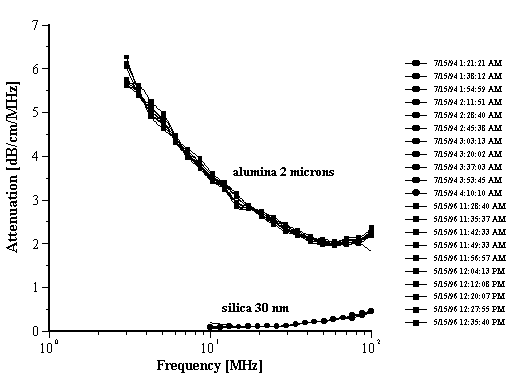
Figure 8.
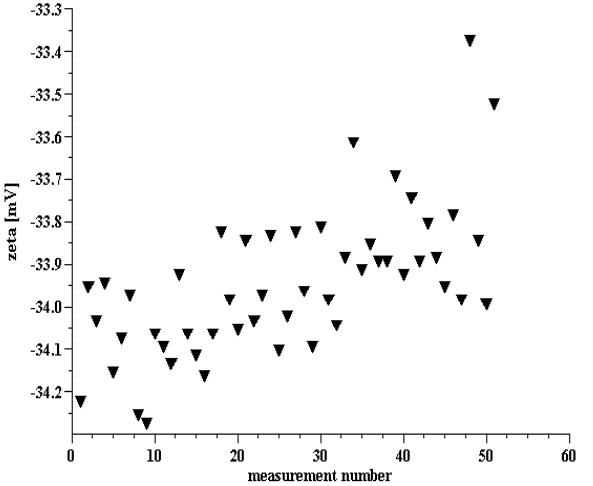
Figure 9
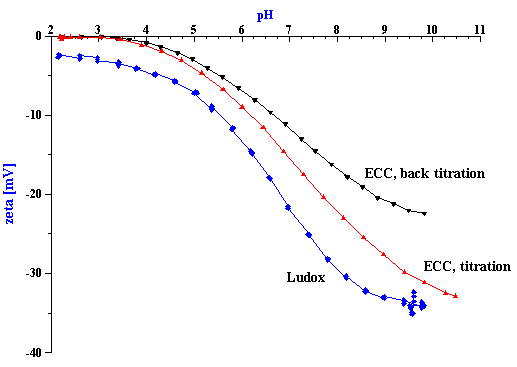
Figure 10
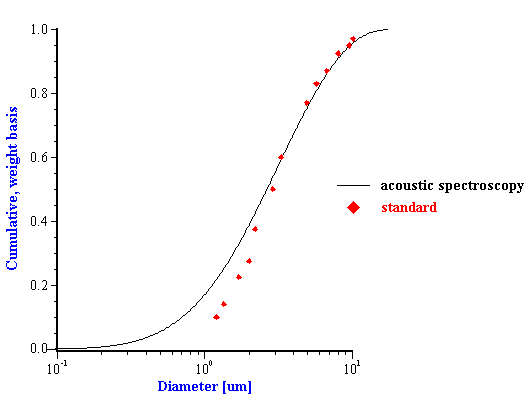
Figure 11.
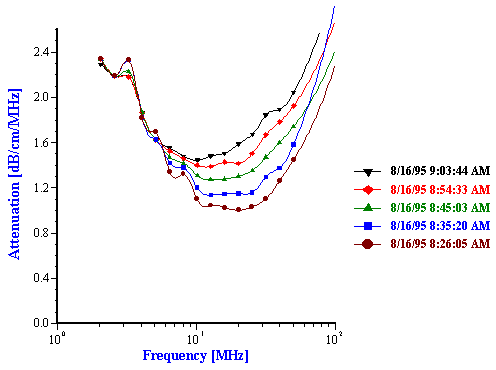
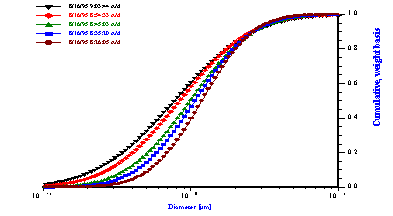
Figure 12.
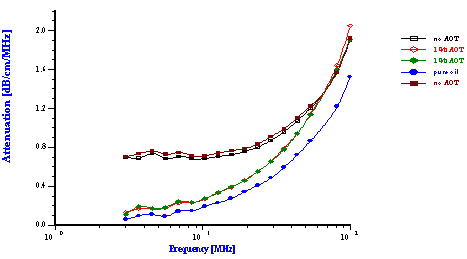
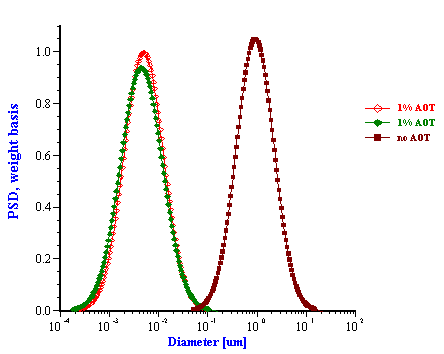
Figure 13.
|
|
Figure 14.
|
|
Figure 15.
|
|
|
|
Figure 16.
|
|
Figure 17
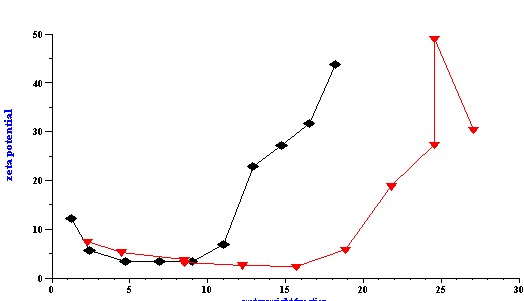
Figure 18.
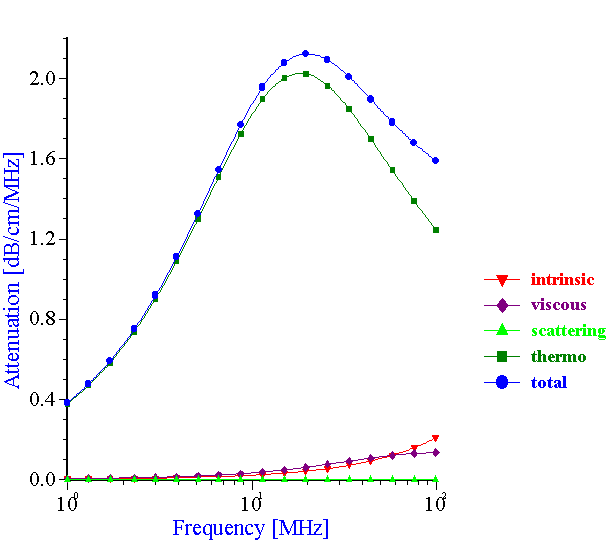
Figure 19
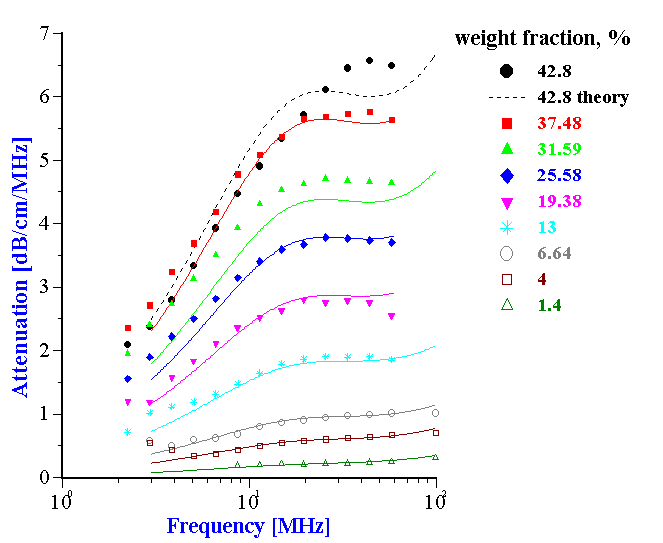
Figure 20.
